Download a PDF of this Backgrounder.
Steven A. Camarota is the director of research and Karen Zeigler is a demographer at the Center.
Recent news coverage of a caravan from Central America hoping to enter the United States illegally has raised interest in the number and characteristics of Central Americans in the country. A new analysis by the Center for Immigration Studies of the latest Census Bureau data, which includes legal and illegal immigrants, shows that the size of the Central American immigrant population (from Guatemala, El Salvador, Belize, Honduras, Nicaragua, Costa Rica, and Panama) has grown enormously in recent decades. It also shows immigrants from the region often struggle with high rates of poverty and welfare use and low average incomes. The reason this is the case is not due to an unwillingness to work. In fact, Central Americans (ages 18 to 64) are slightly more likely to hold a job than native-born Americans. Rather their high rates of poverty and welfare use are due to their low levels of education, which, as their numbers have soared, have declined dramatically relative to natives.
Among the findings:
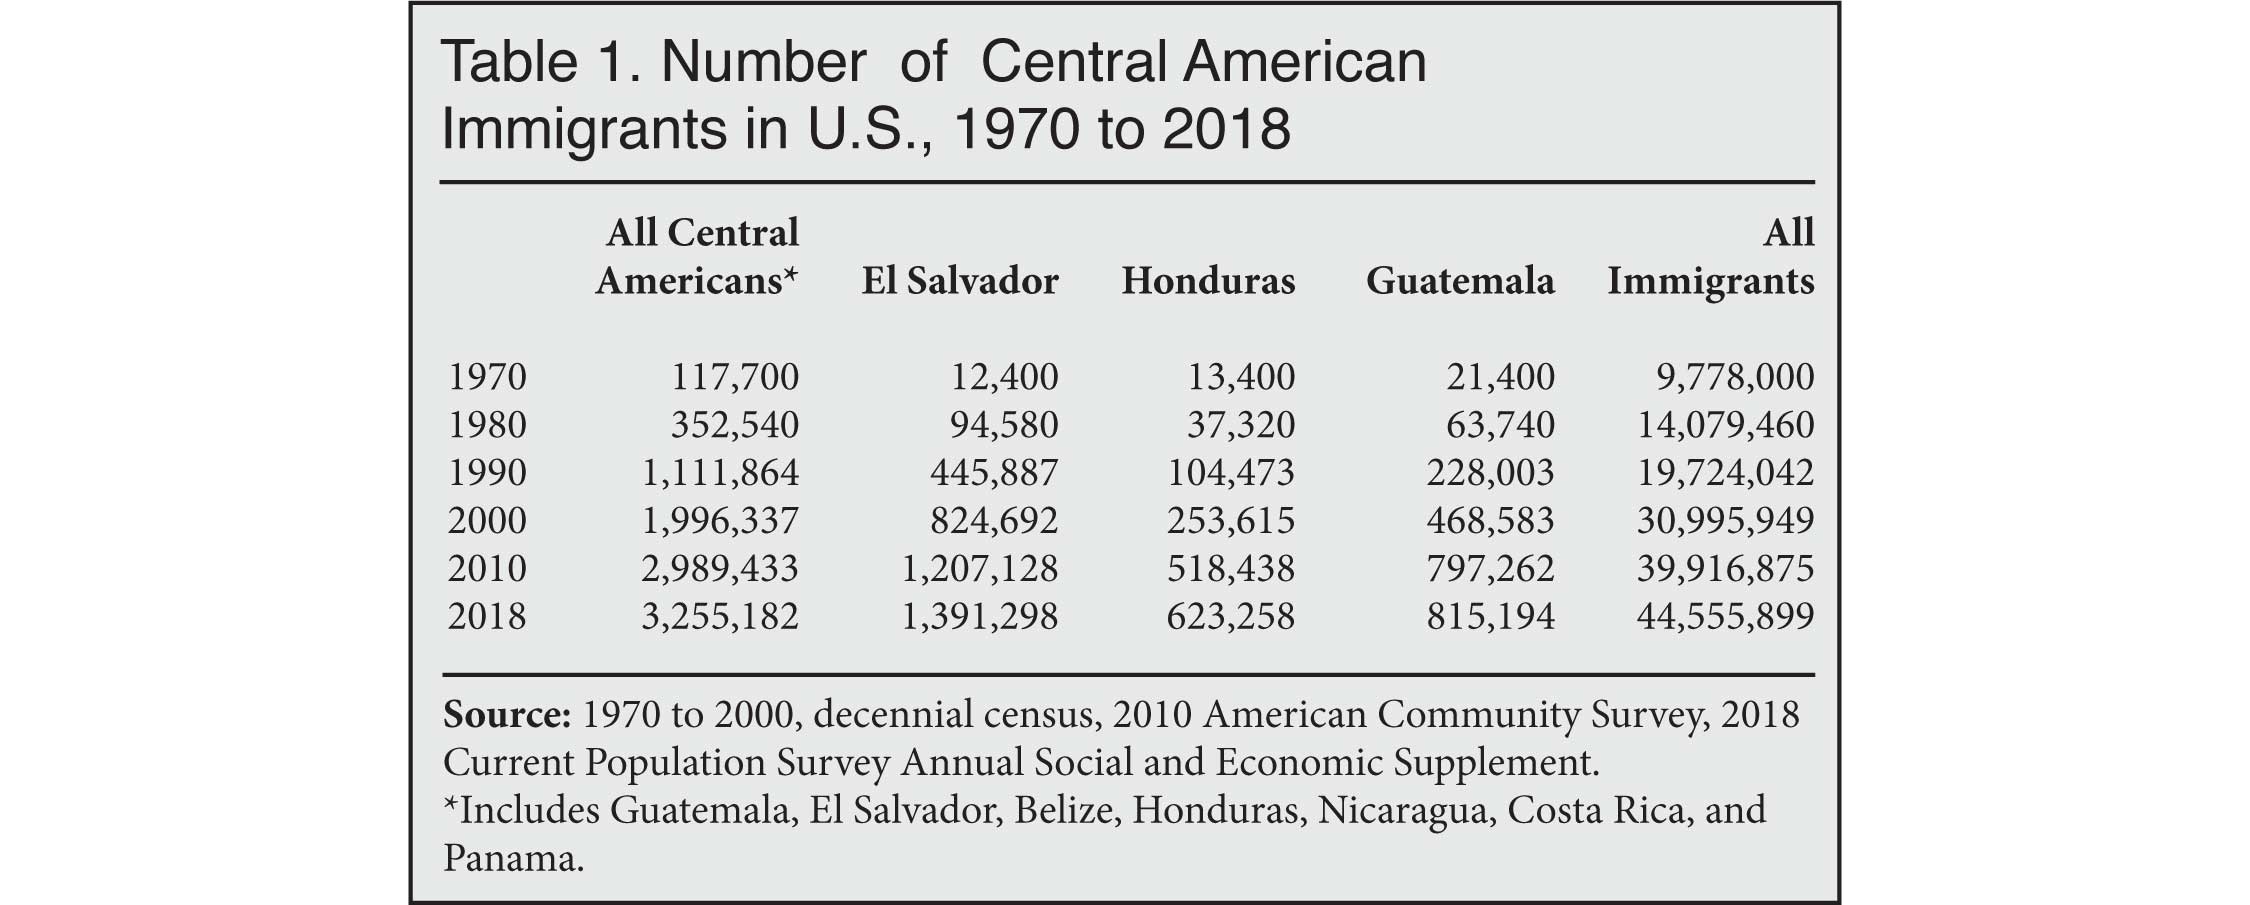
- The number of immigrants from Central America (legal and illegal) has grown 28-fold since 1970, from 118,000 to nearly 3.3 million in 2018 — six times faster than the overall immigrant population.
- In 2018, 87 percent of Central American immigrants came from three countries — El Salvador, Guatemala, and Honduras.
- El Salvador is the largest sending country from the region, with 1.4 million immigrants in the United States, a 112-fold increase since 1970. Guatemala is second with 815,000, followed by Honduras with 623,000.
- Based on prior estimates by the Department of Homeland Security, slightly more than half of El Salvadorans are in the country illegally, as are about two-thirds of Guatemalans and Hondurans.1
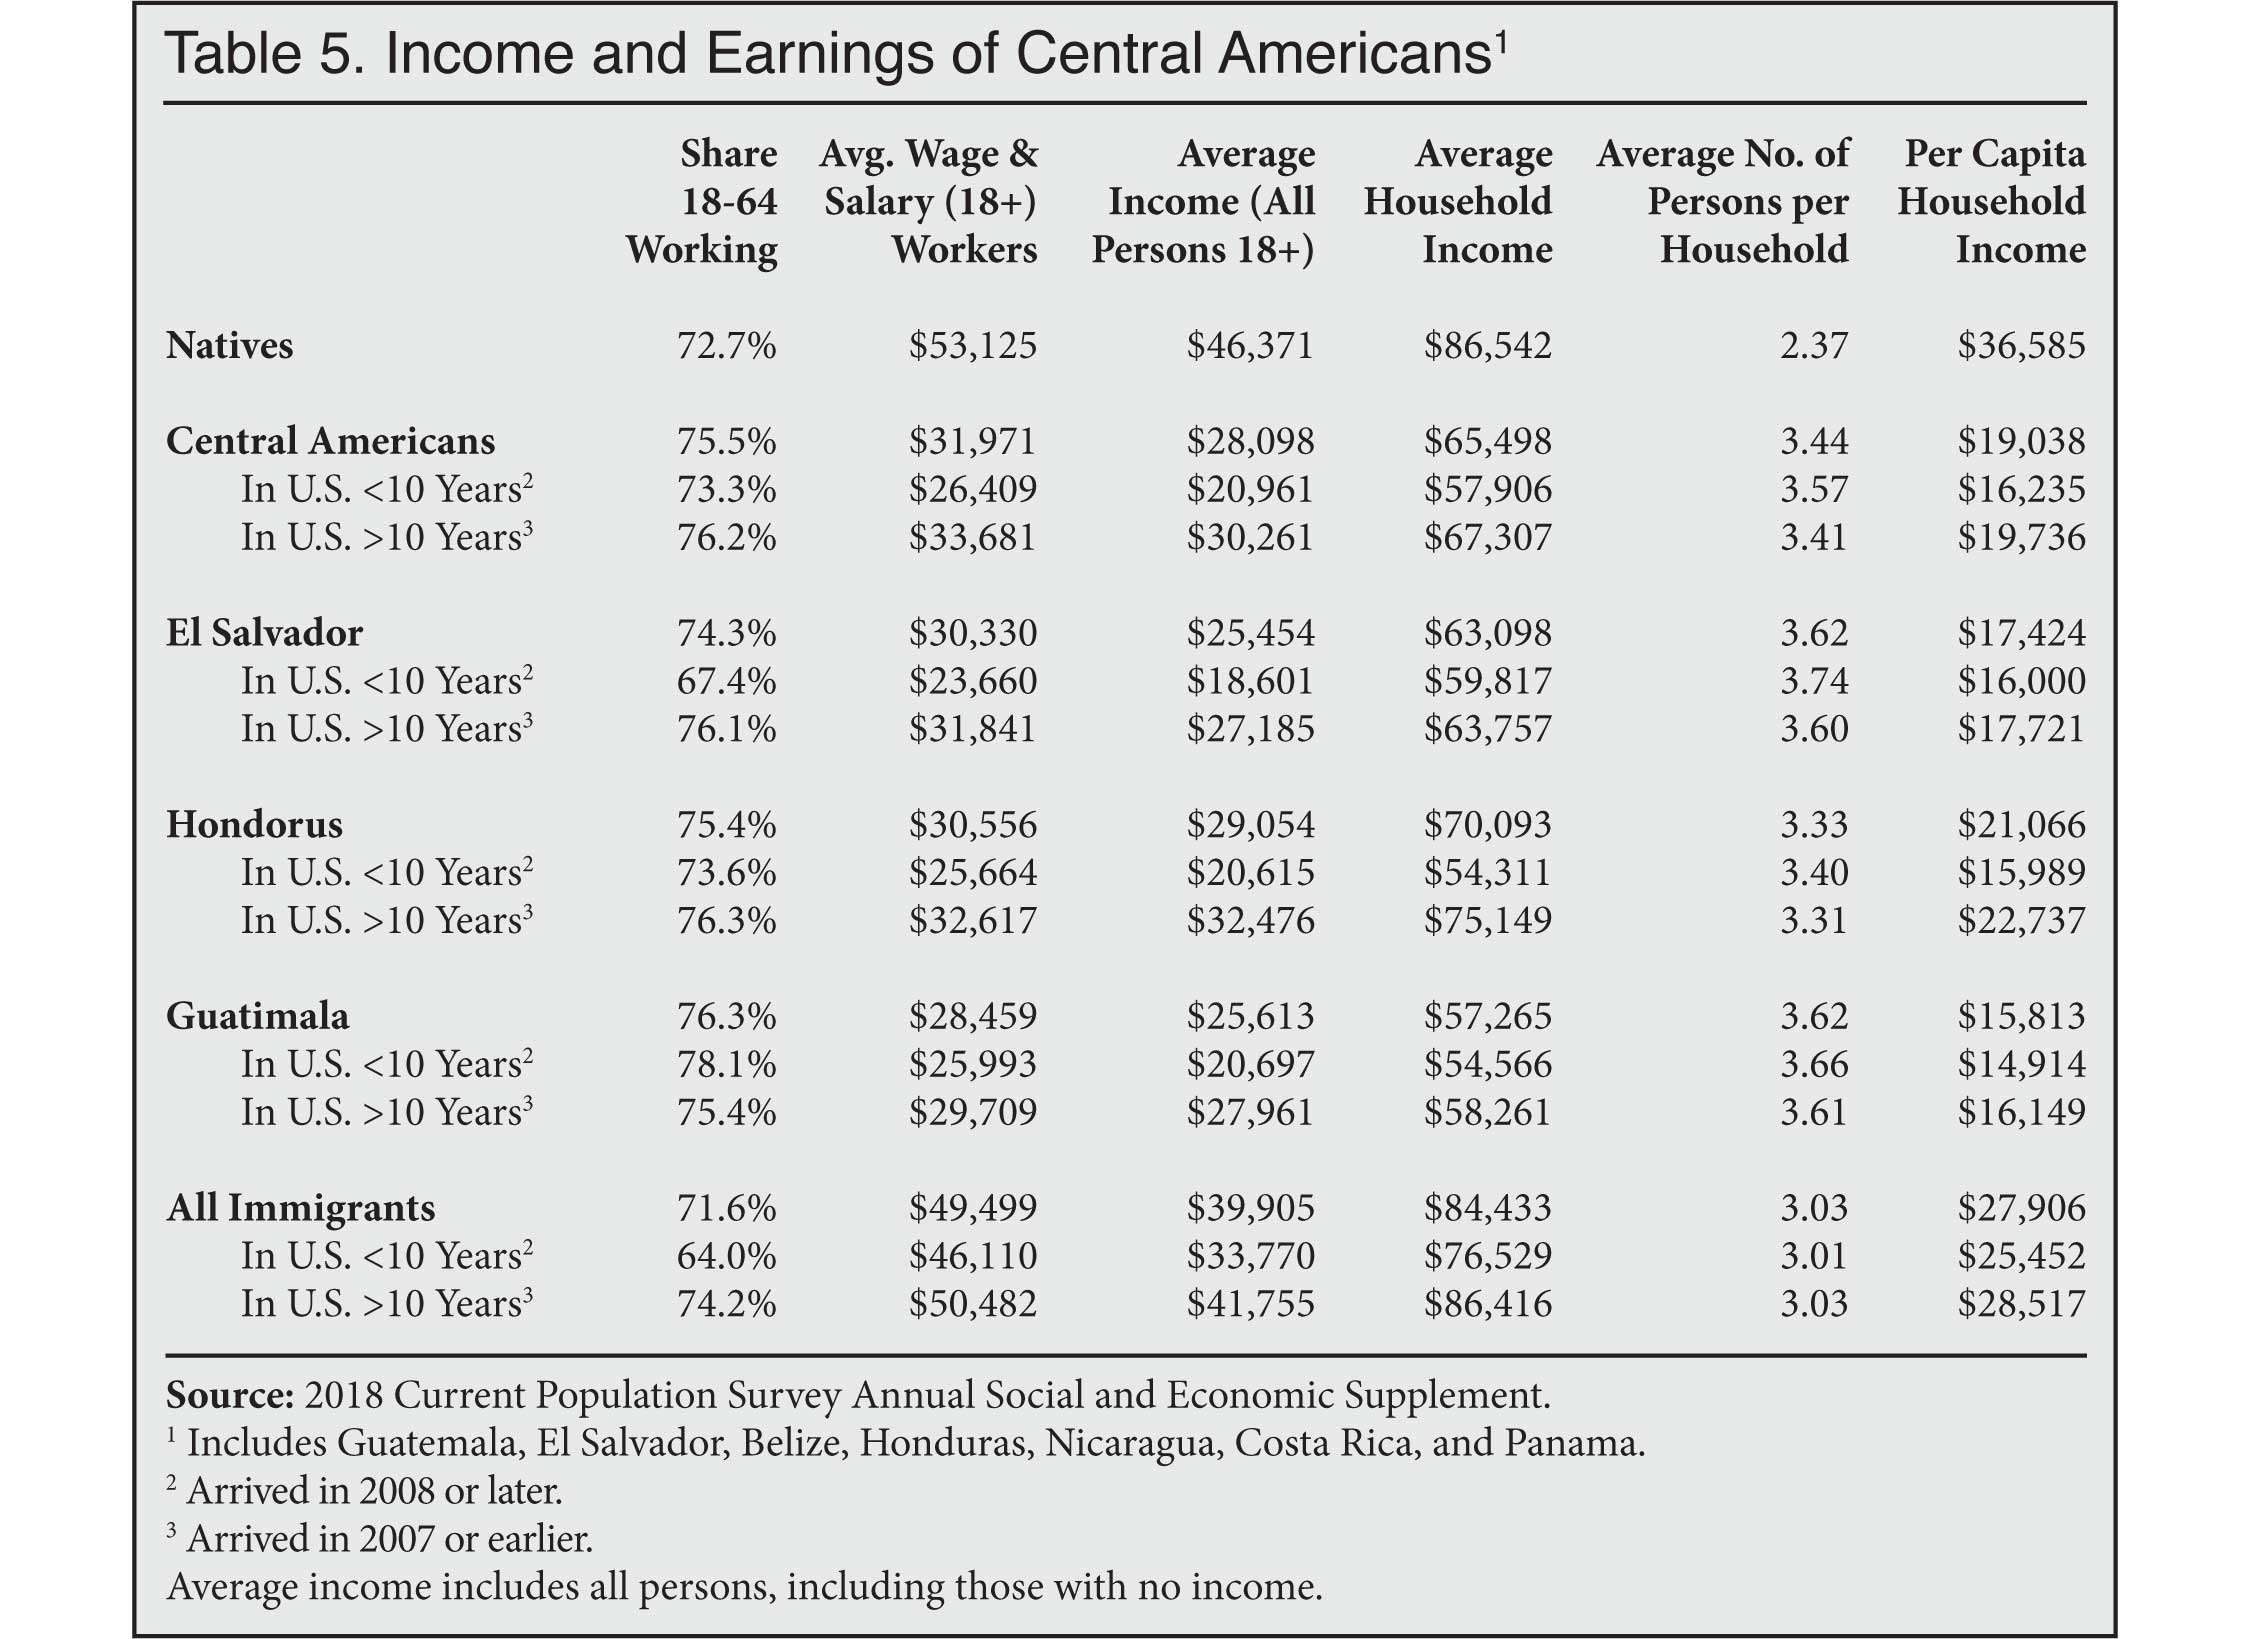
- A large share of Central Americans struggle in the United States, but it is not because they are unwilling to work. In fact, 76 percent of working-age immigrants from the region had a job in the first part of 2018, compared to 73 percent of the native-born.
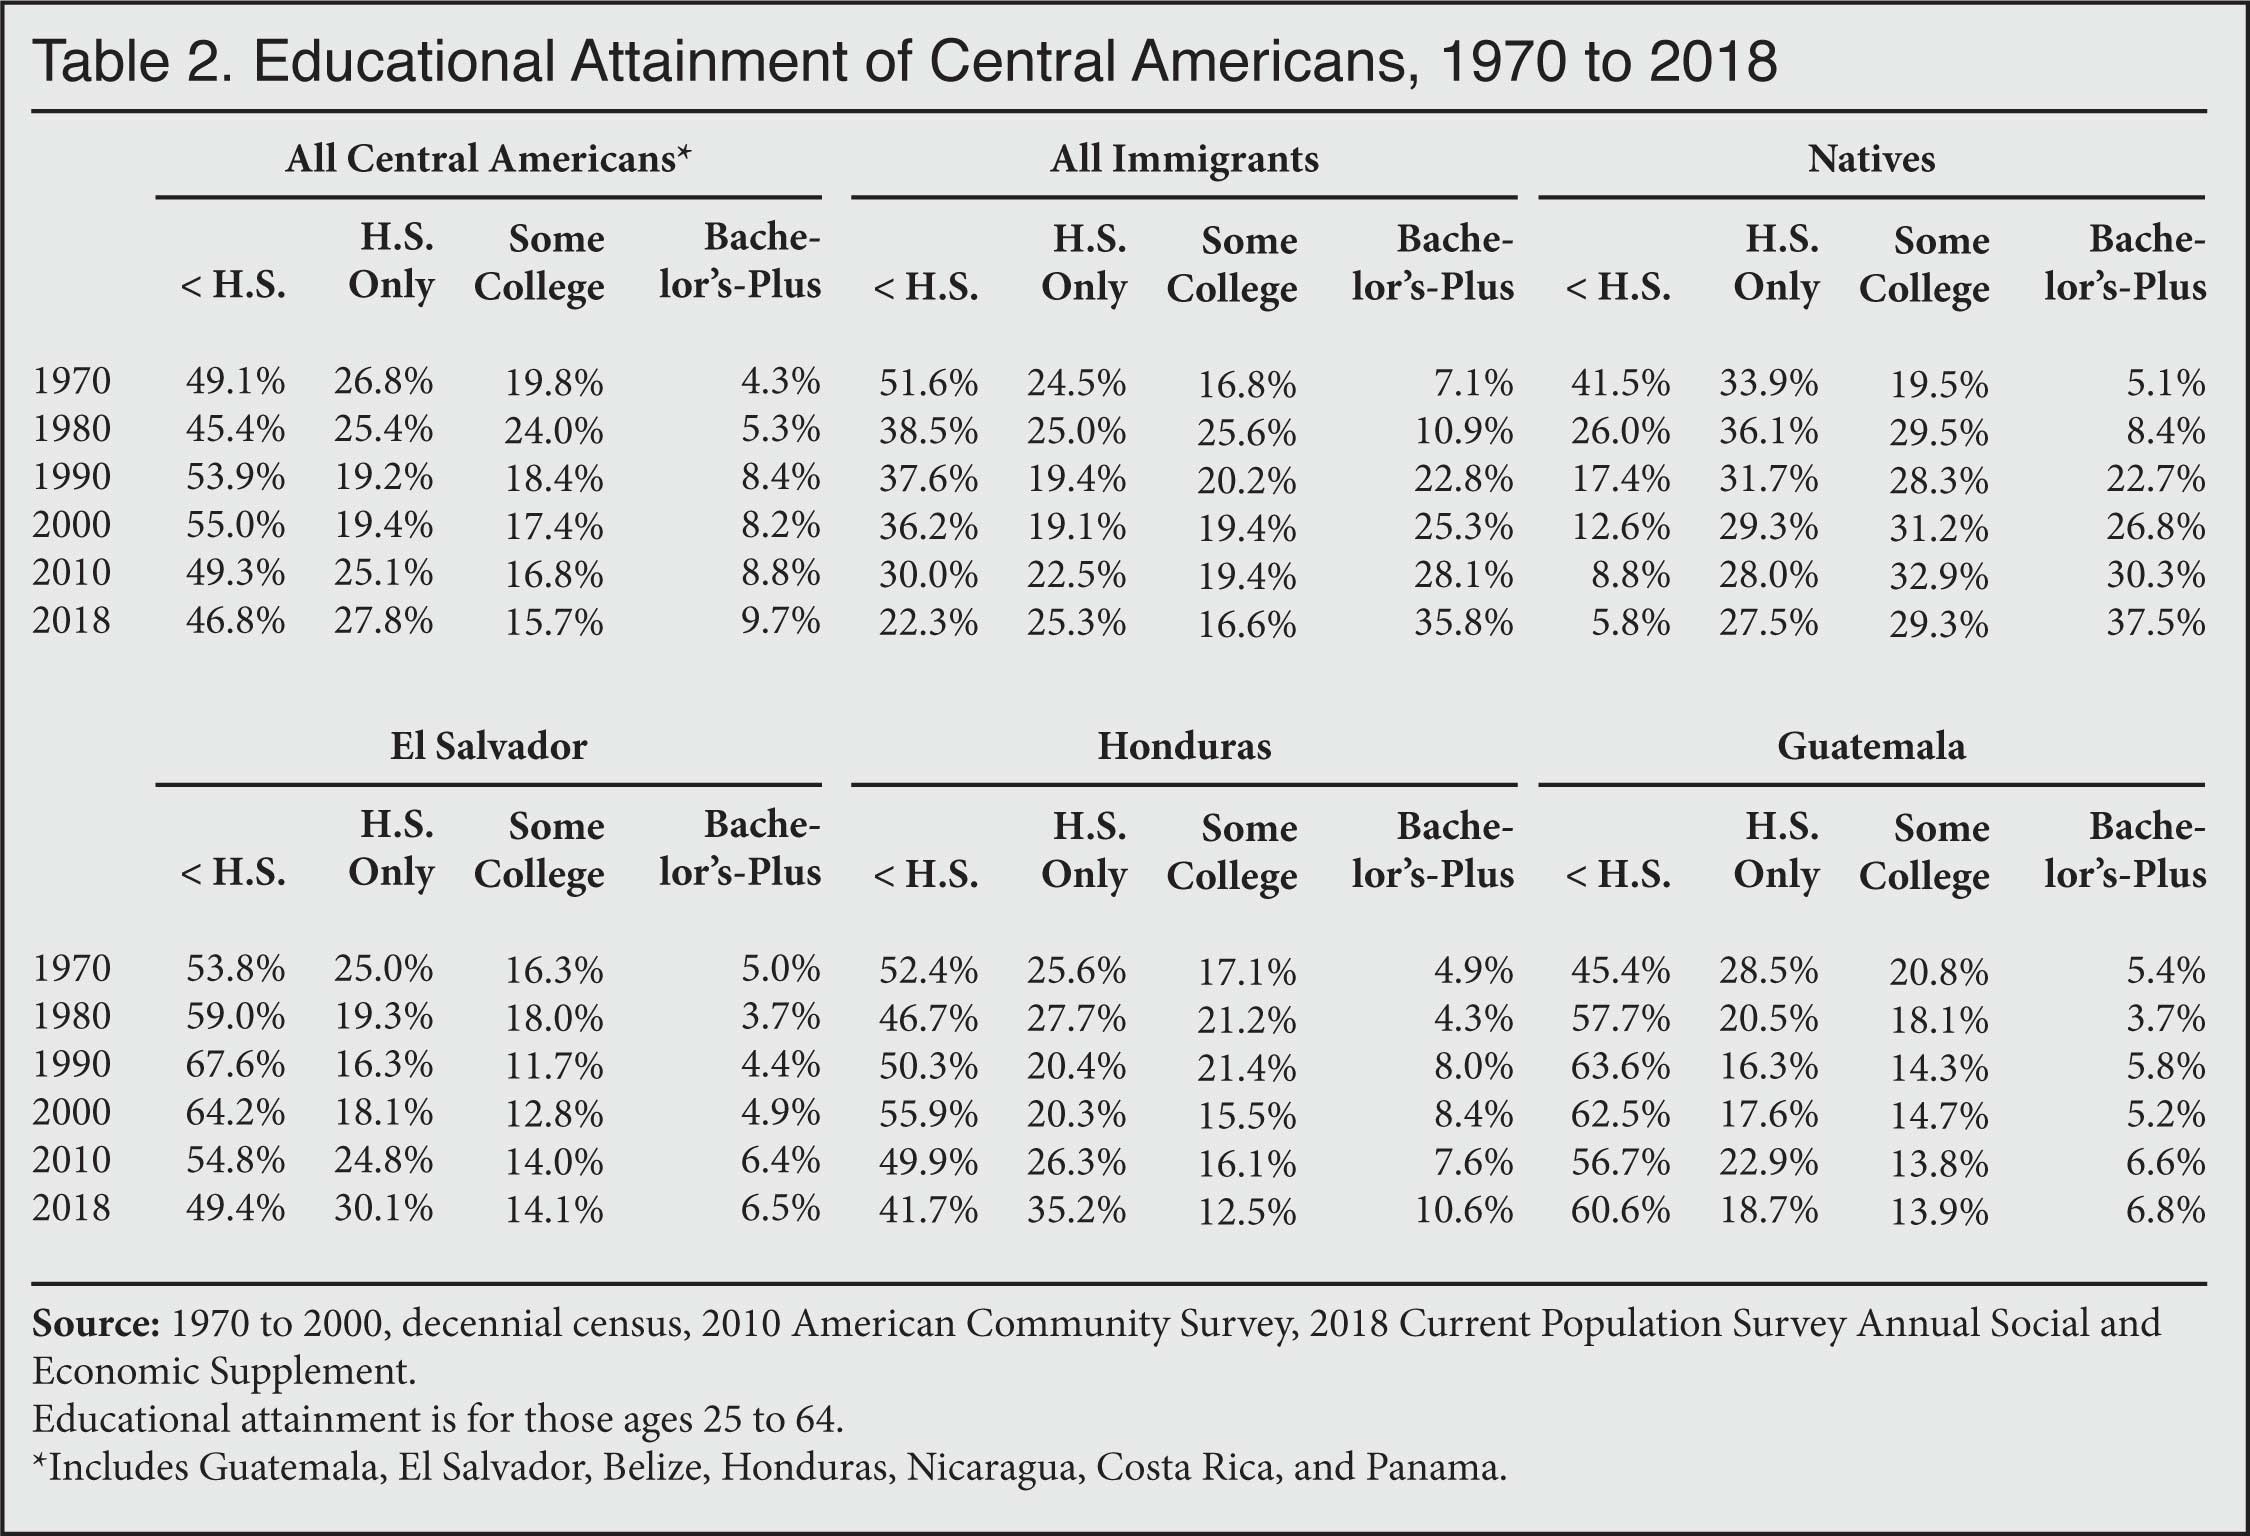
- The primary reason so many Central Americans are poor and access welfare is that, as their population has grown in the United States, their education level relative to natives has declined dramatically:
- In 1970, 49 percent of Central Americans had not completed high school, compared to 42 percent of natives — a seven percentage-point gap. In 2018, 47 percent of Central Americans had not completed high school, compared to 6 percent of natives — a 41 percentage-point gap.
- In 1970, 4 percent of Central Americans had at least a bachelor's degree, compared to 5 percent of natives — a one percentage-point gap. In 2018, 10 percent of Central Americans had at least a bachelor's degree, compared to 38 percent of natives — a 28 percentage-point gap.
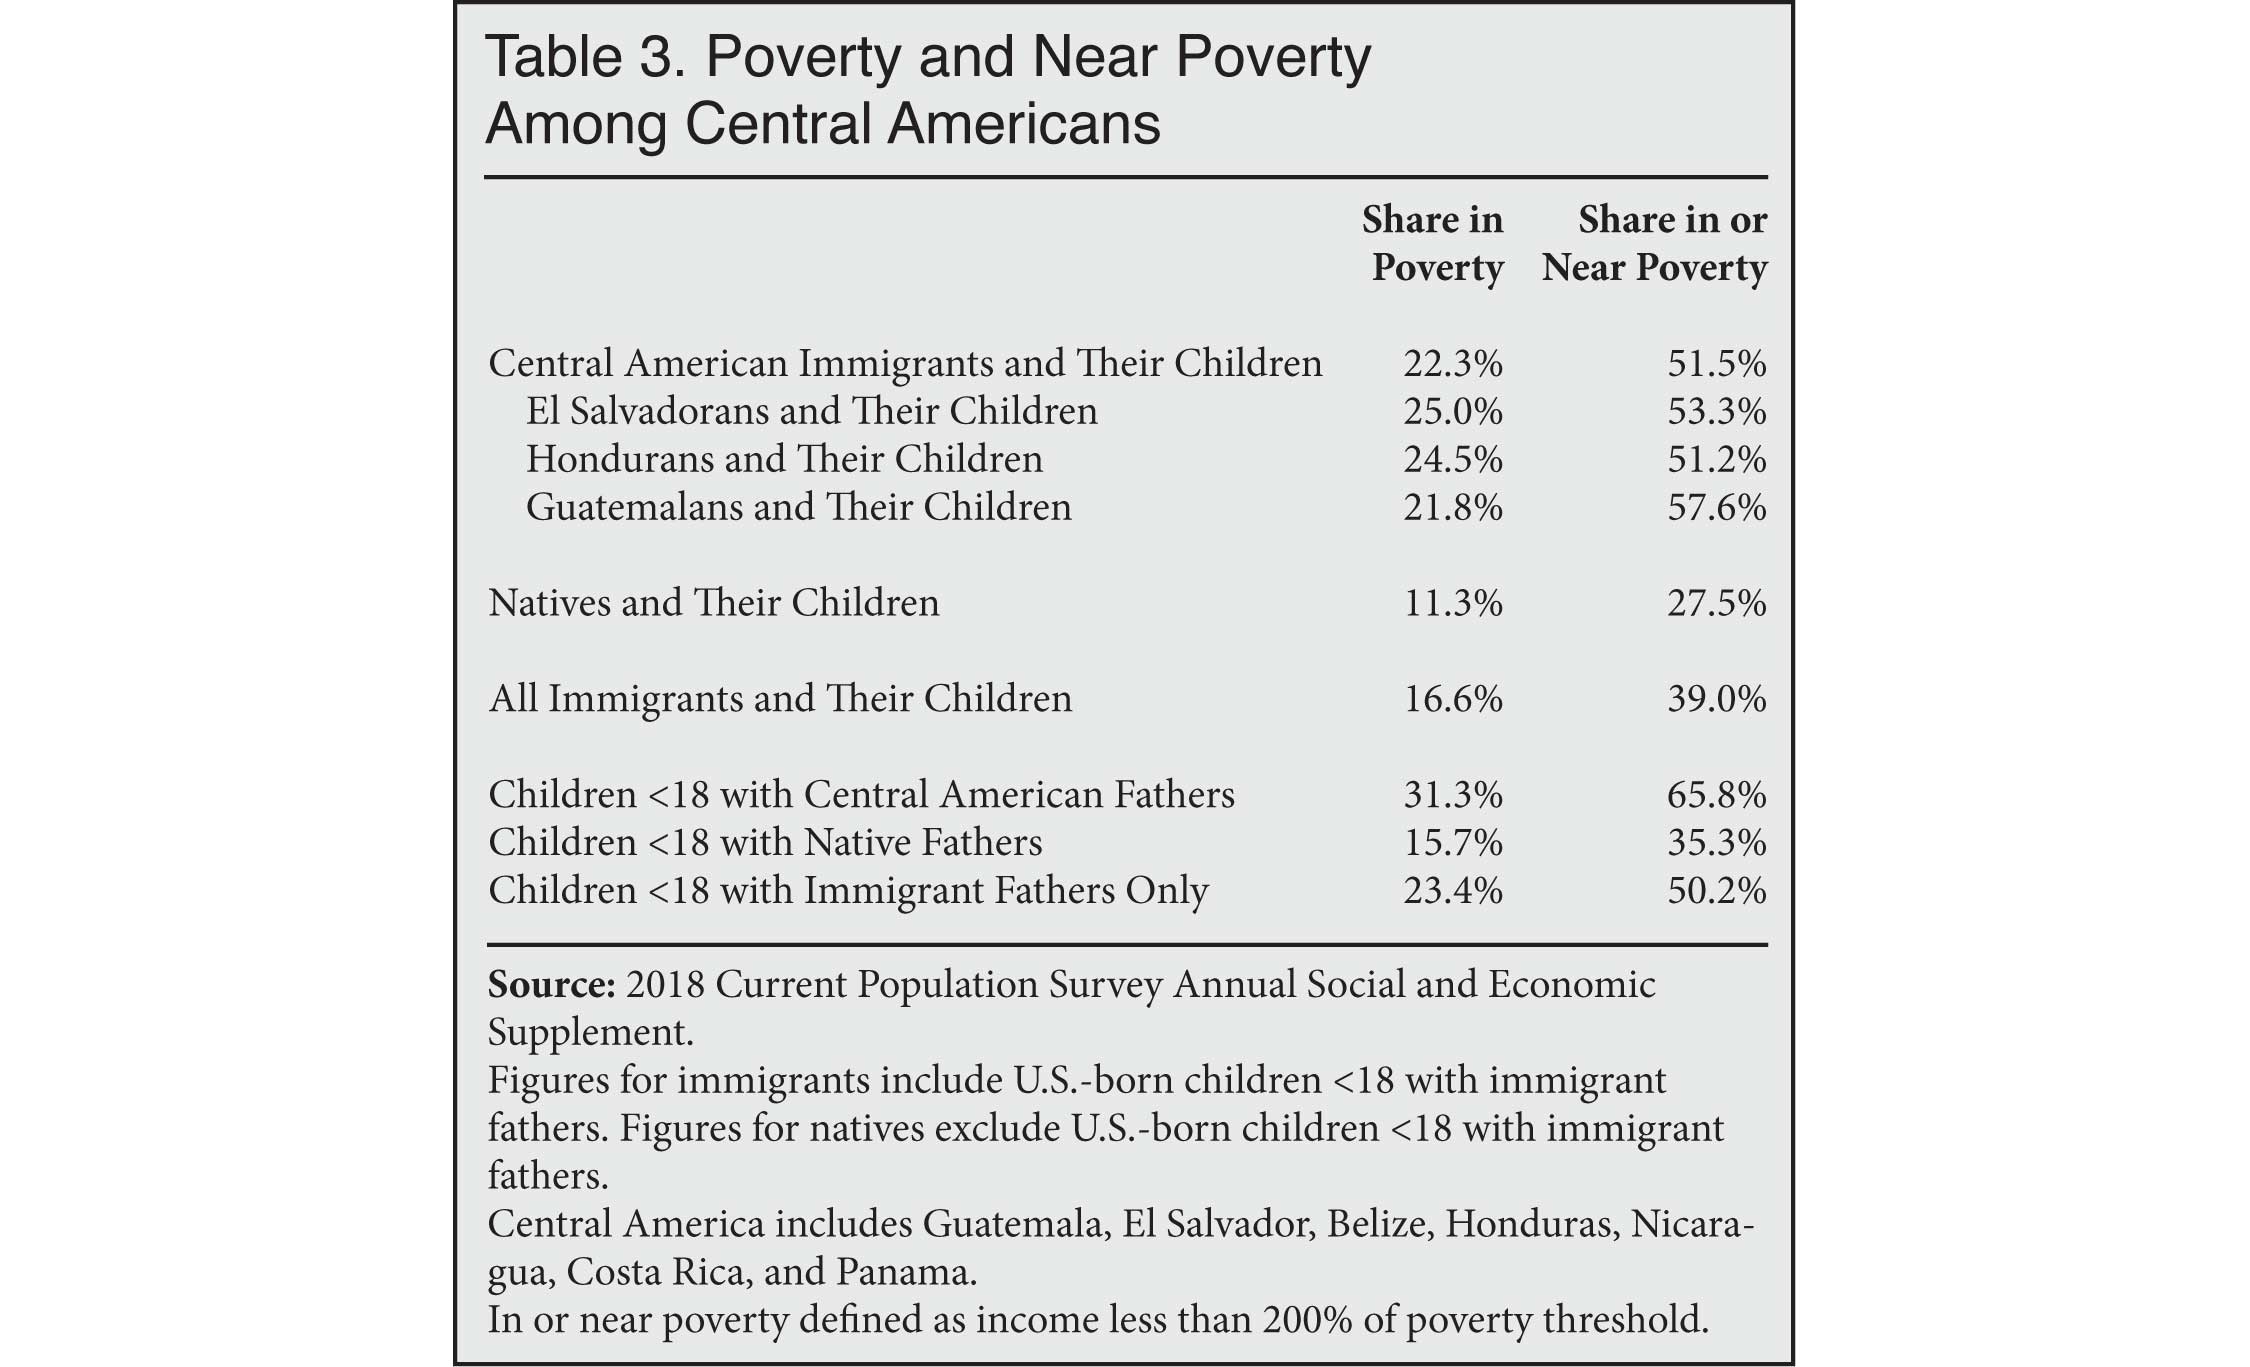
- Because such a large share of Central Americans have modest levels of education, the share of immigrants and their young children from the region who live in poverty is twice that of natives — 22 percent vs. 11 percent.
- Perhaps most troubling, 31 percent of the children (under age 18) of Central Americans live in poverty, roughly double the 16 percent rate for the children of natives. Also, 66 percent of the young children of Central Americans live in or near poverty.
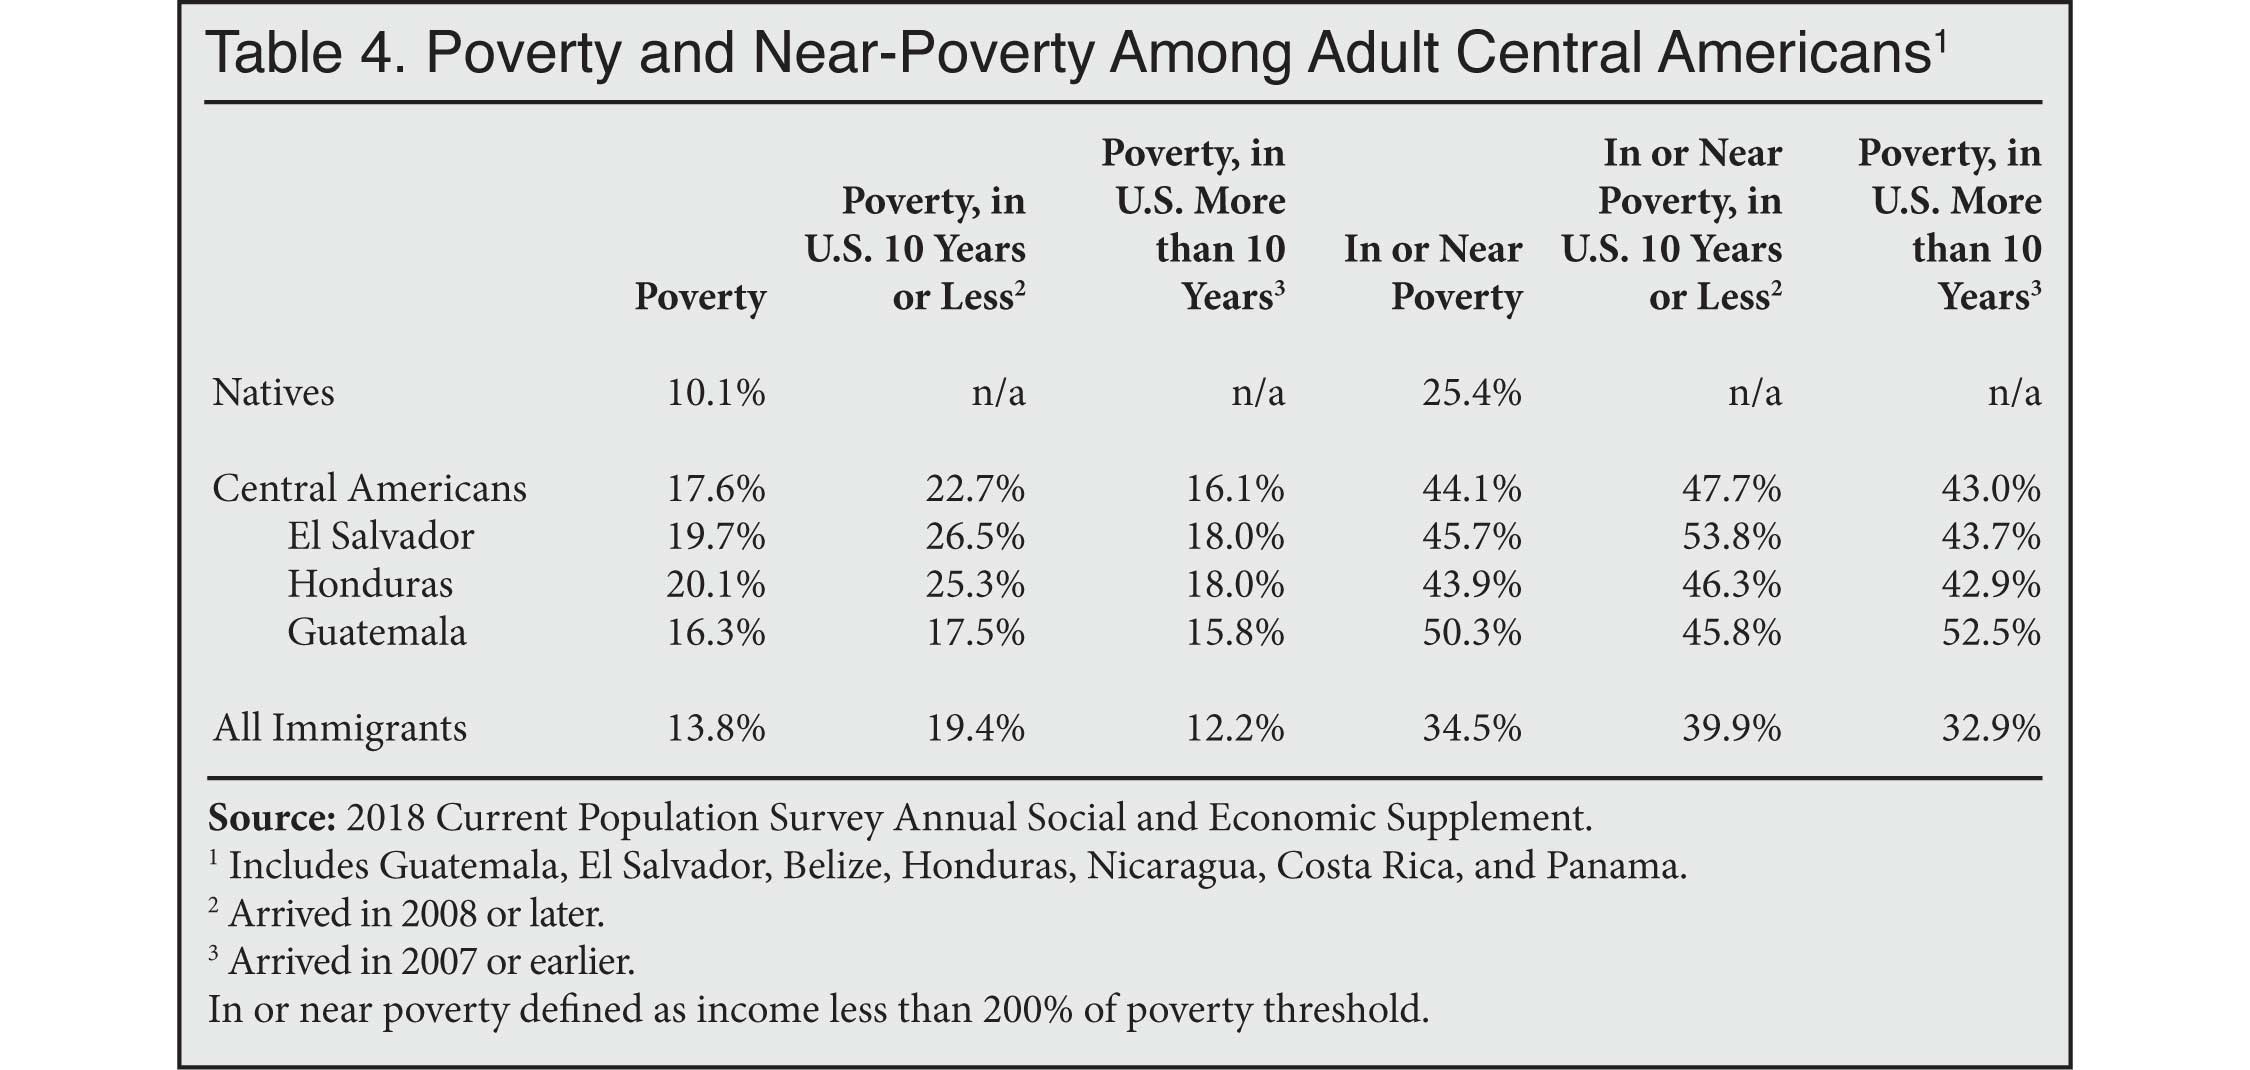
- On average, Central Americans make only 61 percent as much as the average native-born American. Even Central Americans who have lived in the country for more than 10 years still only have 65 percent of the average income of the native-born.
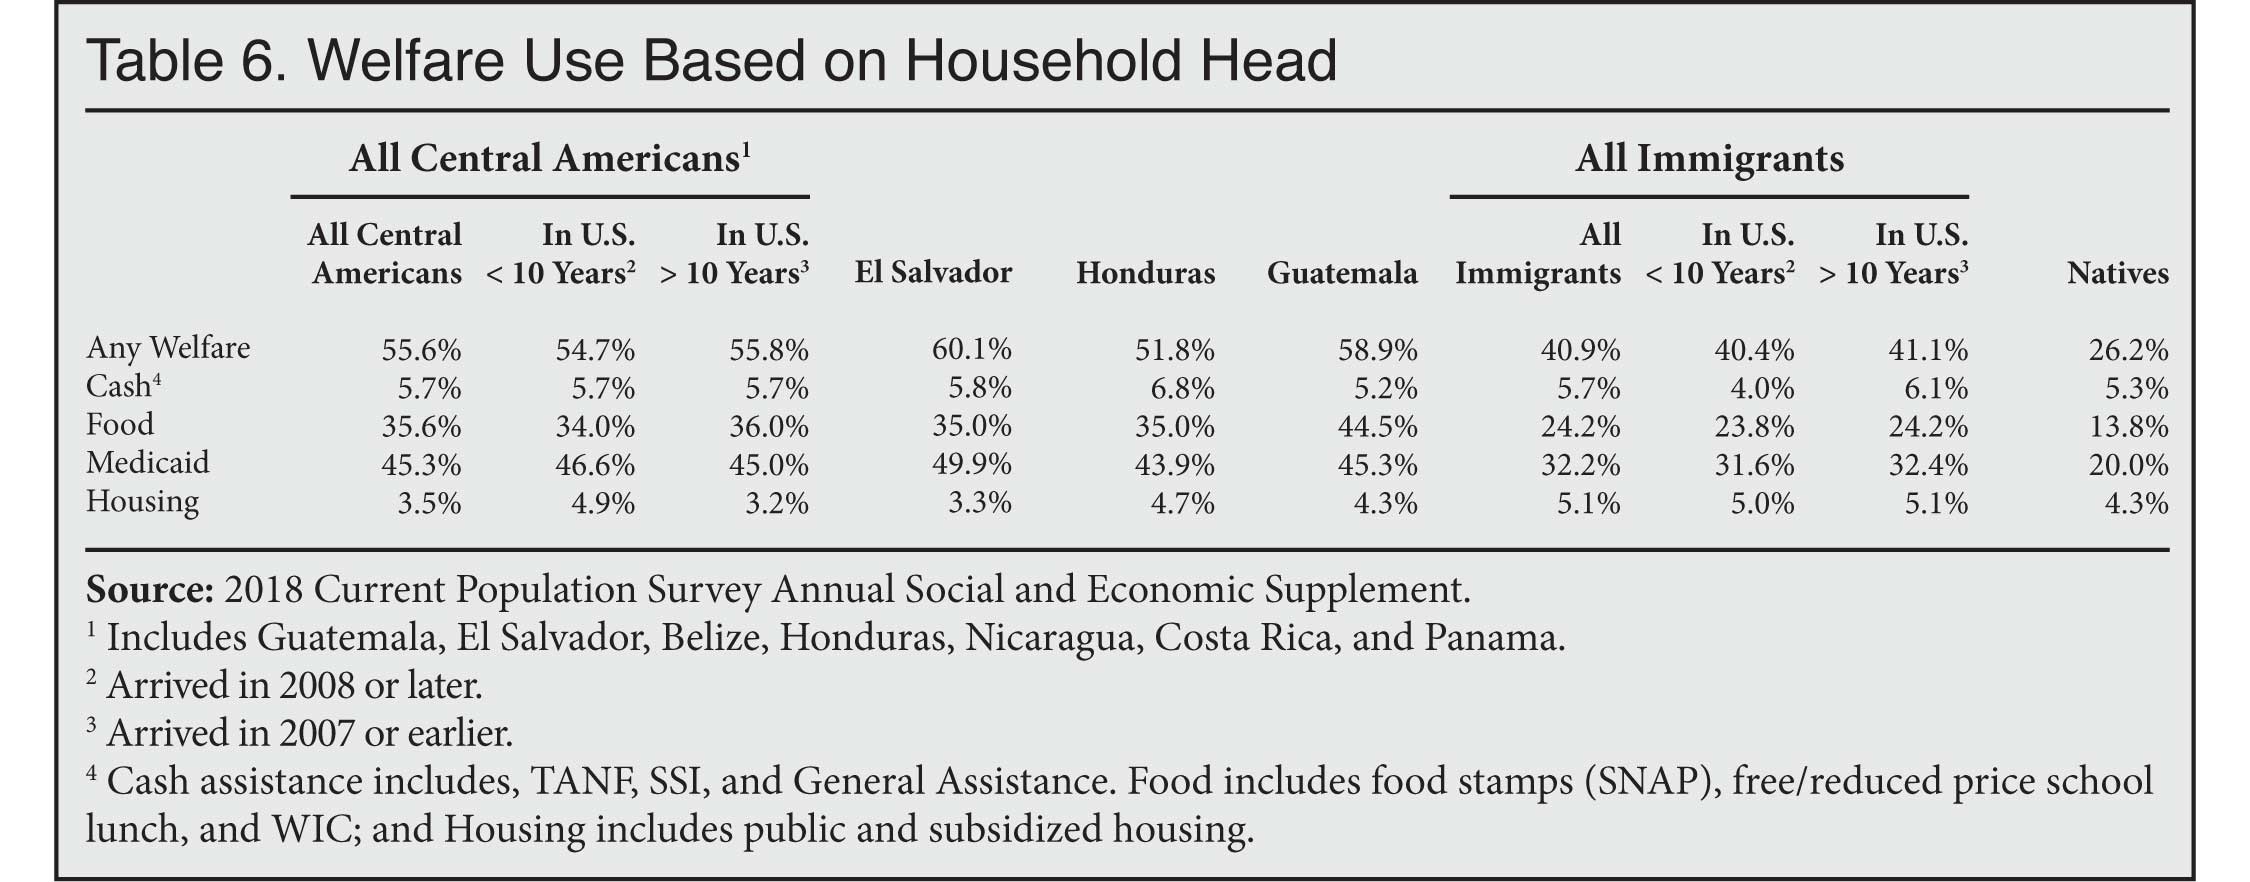
- Given the large share of Central Americans with low incomes, it is not surprising that so many access the welfare system. In 2018, 56 percent of households headed by Central American immigrants used one or more major welfare programs, more than double the 26 percent of native households.
- The welfare figures for 2018 come from the Current Population Survey (CPS), which understates welfare use, particularly among immigrants. So the actual welfare use rates are even higher than those reported here.2
- Although illegal immigrants and new legal immigrants are barred from most welfare programs, the restrictions do not apply to all programs. Moreover, some states allow otherwise ineligible immigrants to access programs at state expense; and most important, immigrants, including illegal immigrants, can receive benefits on behalf of U.S.-born children, who are awarded citizenship at birth.
- The high welfare use of Central Americans reflects the fact that, while most work, their education levels mean they often earn low wages in the modern American economy and are unable to support themselves or their own children in many cases and turn to American taxpayers by using the welfare system.
- Welfare use is common among both recently arrived and more established Central Americans. Among households headed by Central Americans in the country for 10 years or less, 55 percent used one or more welfare programs, while the figure is 56 percent for households headed by a Central American in the country for more than 10 years.
- Welfare use is very high for all three top-sending countries from the region. Of households headed by El Salvadoran immigrants, 60 percent use at least one major welfare program; the figure is 59 percent for Guatemalans and 52 percent for Hondurans.
- Overall, Central American households' use of cash welfare is similar to that of native households, but the share of Central American households receiving some type of food assistance is 2.5 times that of natives — 36 percent vs. 14 percent. The share of Central American households with at least one person on Medicaid is more than double that of native households — 45 percent vs. 20 percent.
Data Source. Data for this analysis for 1970, 1980, 1990, and 2000 come from the public-use files of the decennial census. Figures for 2010 are from the public-use files of the American Community Survey (ACS), and figures for 2018 come from the Annual Social and Economic Supplement of the Current Population Survey. All three data sources are collected by the U.S. Census Bureau and allow for the identification of immigrants by country of birth. The Census Bureau refers to immigrants as the "foreign-born". Immigrants are individuals who were not U.S. citizens at birth. It includes naturalized citizens, legal permanent residents (green card holders), temporary workers, and foreign students. It does not include those born to immigrants in the United States, including to illegal immigrant parents, or those born in outlying U.S. territories, such as Puerto Rico. Prior research by the Department of Homeland Security and others indicates that some 90 percent of illegal immigrants respond to the ACS.3 Thus, all the figures reported above are for both legal and illegal immigrants. Of Central American immigrants in the country, slightly more than half are likely here without authorization.
End Notes
1 The most recent estimates from DHS are for 2014, which show 700,000 illegal immigrants from El Salvador, 640,000 from Guatemala, and 400,000 from Honduras. The 2014 American Community Survey for that year shows there were 1.32 million total immigrants (legal and illegal) from El Salvador in the country, 916,000 from Guatemala, and 588,000 from Honduras. DHS estimates are derived from Census Bureau data and include a slight undercount adjustment. Nonetheless, it still means that about half of immigrants in 2014 from El Salvador were in the country illegally, as were somewhat more than two-thirds from Guatemala and Honduras. See Bryan Baker, "Estimates of the Unauthorized Immigrant Population Residing in the United States: January 2014", Department of Homeland Security, Office of Immigration Statistics, July 2017.
2 In 2014, for example, the Survey of Income and Program Participation (SIPP), released much less frequently than the CPS, showed 49 percent of all immigrant households used at least one welfare program, as did 30 percent of native households — a 19 percentage-point gap. In contrast, the CPS from that year showed 41 percent of immigrant households used welfare compared to 25 percent of native households — a 16 percentage-point gap. Unfortunately, the 2014 SIPP is the newest data available and it does not allow for an examination of Central American immigrants separately. For more discussion of the difference between CPS and SIPP data see the methodology section of "Welfare Use by Immigrant and Native Households: An Analysis of Medicaid, Cash, Food, and Housing Programs", Center for Immigration Studies Backgrounder, September 10, 2015.
3 Bryan Baker, "Estimates of the Unauthorized Immigrant Population Residing in the United States: January 2014", Department of Homeland Security, Office of Immigration Statistics, July 2017, Table 2, p. 5.