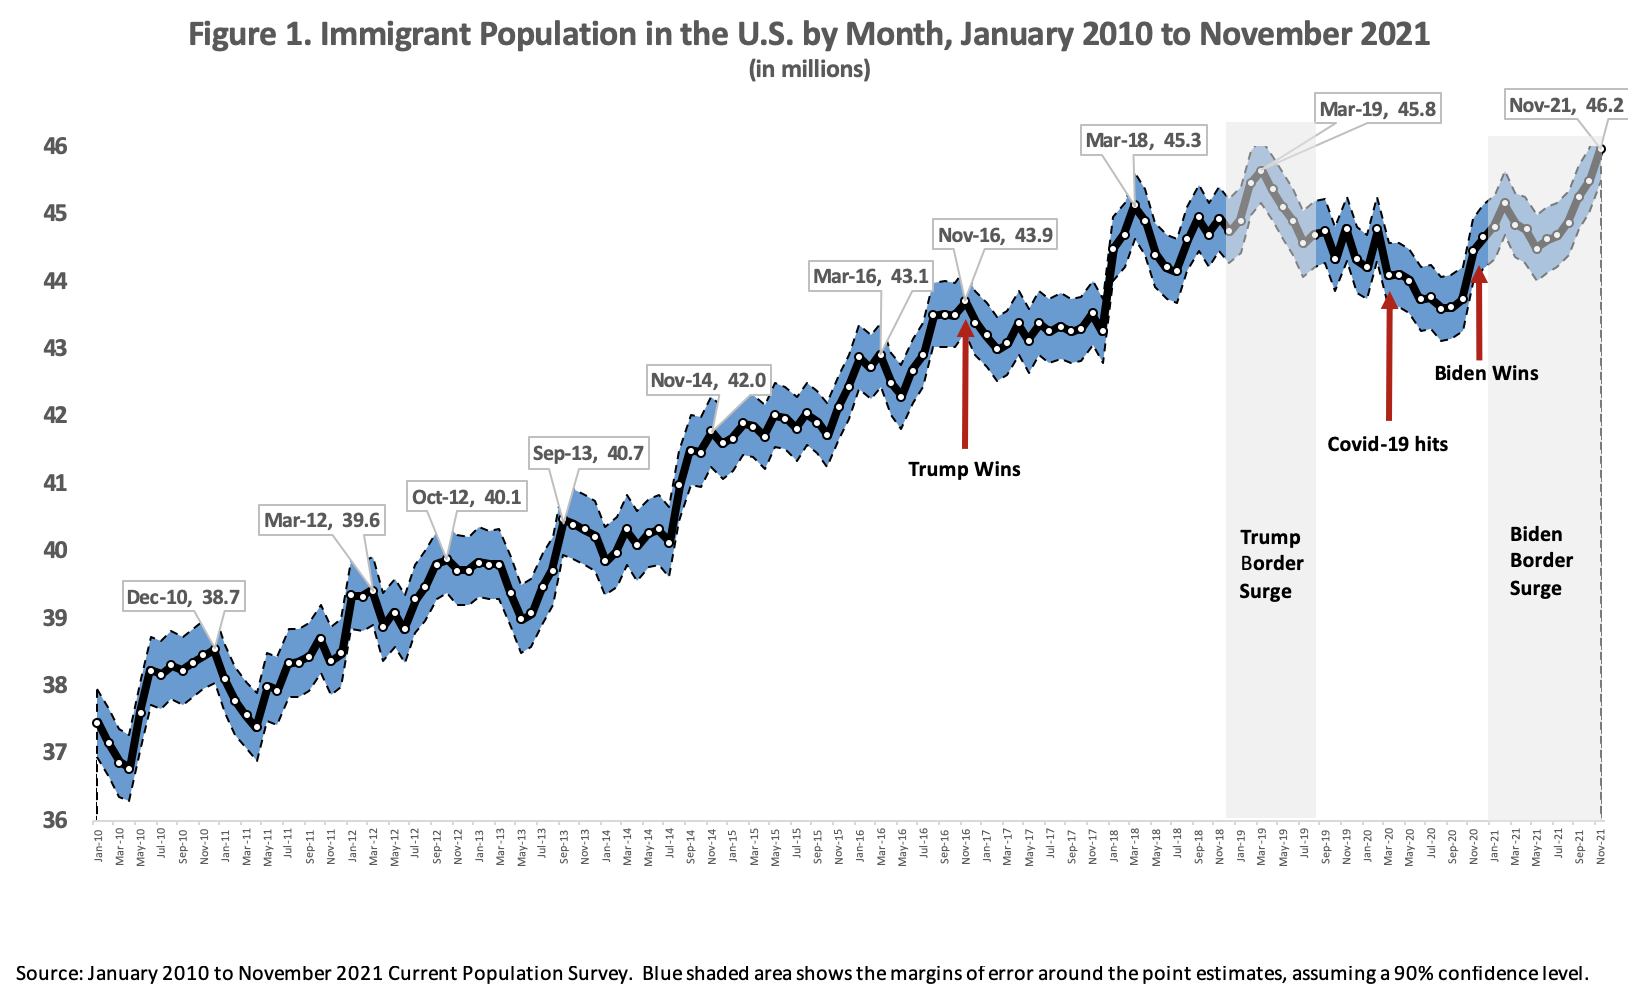
An analysis of the Census Bureau’s monthly Current Population Survey (CPS) from November 2021 shows the total immigrant population (legal and illegal) in the U.S. hit 46.2 million, the highest number ever recorded in American history. Immigrants are also referred to by the government as the “foreign-born”. The overall immigrant population fell through the middle of 2020 and then rose dramatically after Biden’s victory. There is a lot of variation from month to month in the CPS, so any change should be interpreted in light of this variability. The growth and size of the immigrant population in the CPS are important because, unlike arrival figures for legal immigrants or border apprehensions, the CPS measures the total number of foreign-born people living in the country, which is what ultimately determines immigration’s impact on American society.
For the immigrant population to grow, new arrivals must exceed return migration and deaths. Births to immigrants, legal or illegal, in the United States do not add to the foreign-born as all persons born in the United States are considered native-born by definition. New immigration is offset by the nearly one million immigrants we have previously estimated are deported or choose to leave the country each year, and by natural mortality of roughly 300,000 a year among the existing immigrant population. The foreign-born in Census Bureau surveys includes all persons who were not U.S. citizens at birth — mainly naturalized citizens, lawful permanent residents, long-term temporary visitors, and illegal immigrants.
Among the findings:
- There were a total of 46.2 million immigrants (legal and illegal) in the country in November 2021. This is the largest number of immigrants ever recorded in any government survey or census going back to 1850.
- As a share of the total U.S. population, immigrants were 14.2 percent in November 2021 — the highest percentage in 111 years. The immigrant share of the population has tripled since 1970 and has come close to doubling since 1990.
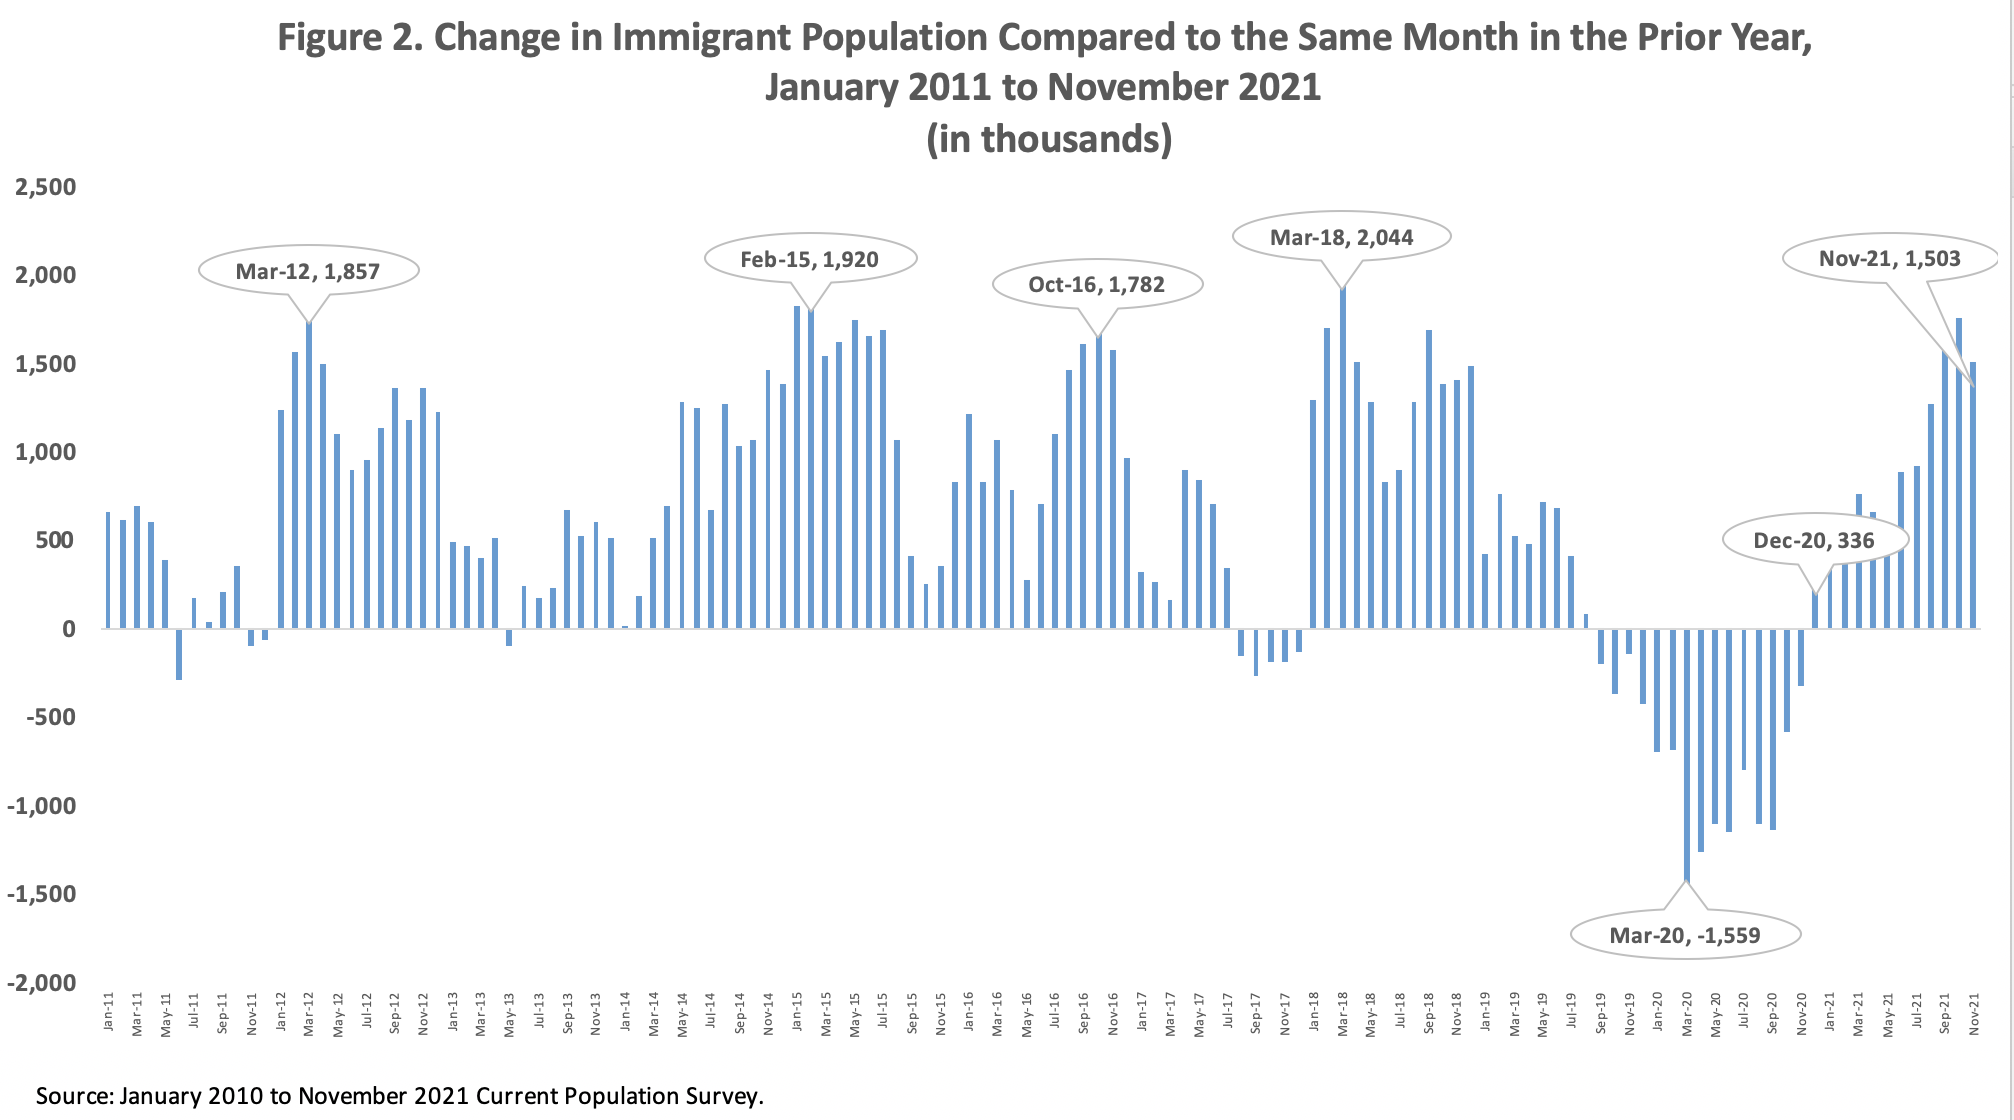
- The number of immigrants in the country grew by 1.5 million between November 2020 and November of this year after declining by 1.2 million between February and September 2020 as a result of Covid-19 restrictions.
- In just the last month — October to November 2021 — the total immigrant population increased by 470,000.
- Like the monthly CPS, the Census Bureau’s annual American Community Survey (ACS) from 2020 also shows a significant decline in the immigrant population through mid-2020, though the Bureau reports problems with that survey. Moreover, the ACS only reflects the population in July 2020, not the large increases since mid-2020.
- In comparison to the 1.5 million increase in the immigrant population after Biden’s victory, in the year after Trump’s victory (November 2016 to November 2017) the immigrant population actually fell slightly. The policies and public statements of different administrations seem to matter a great deal.
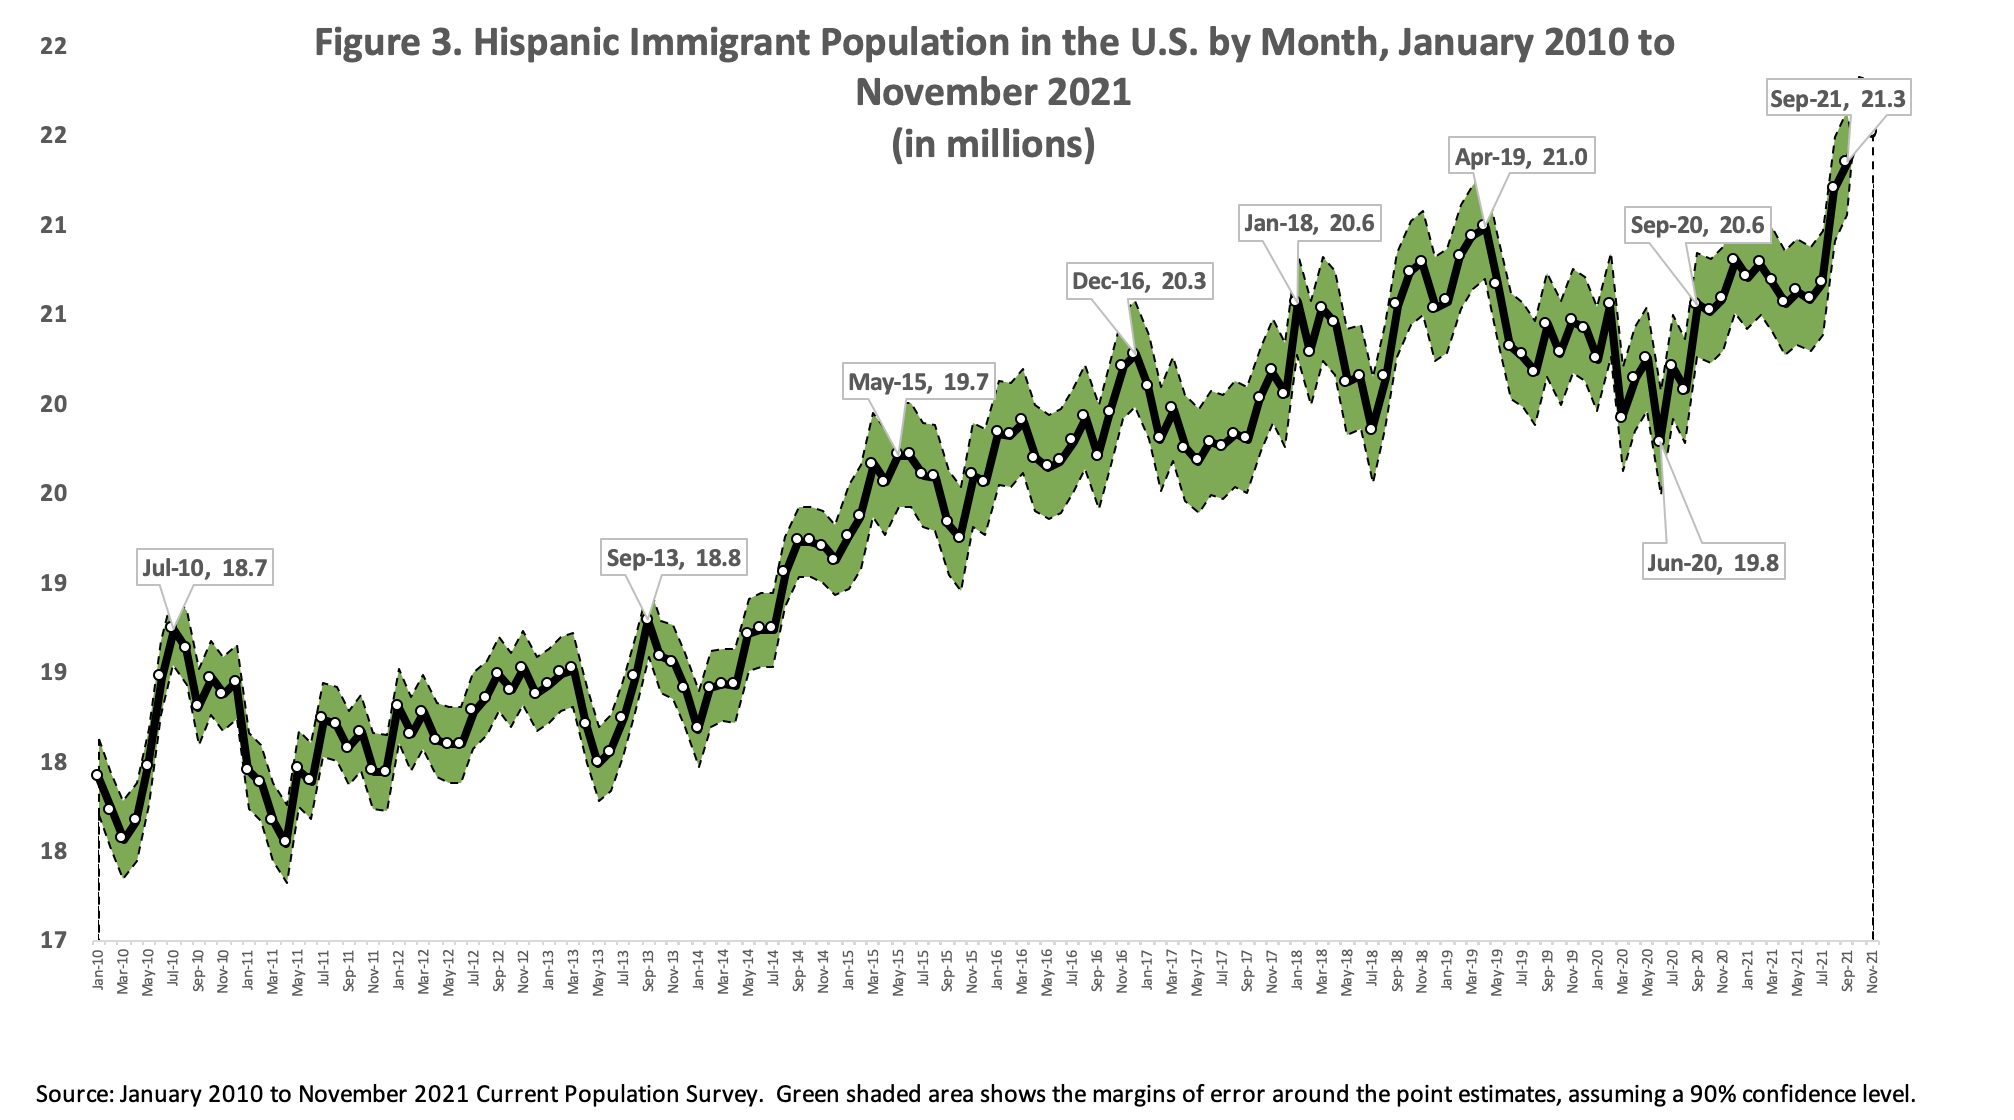
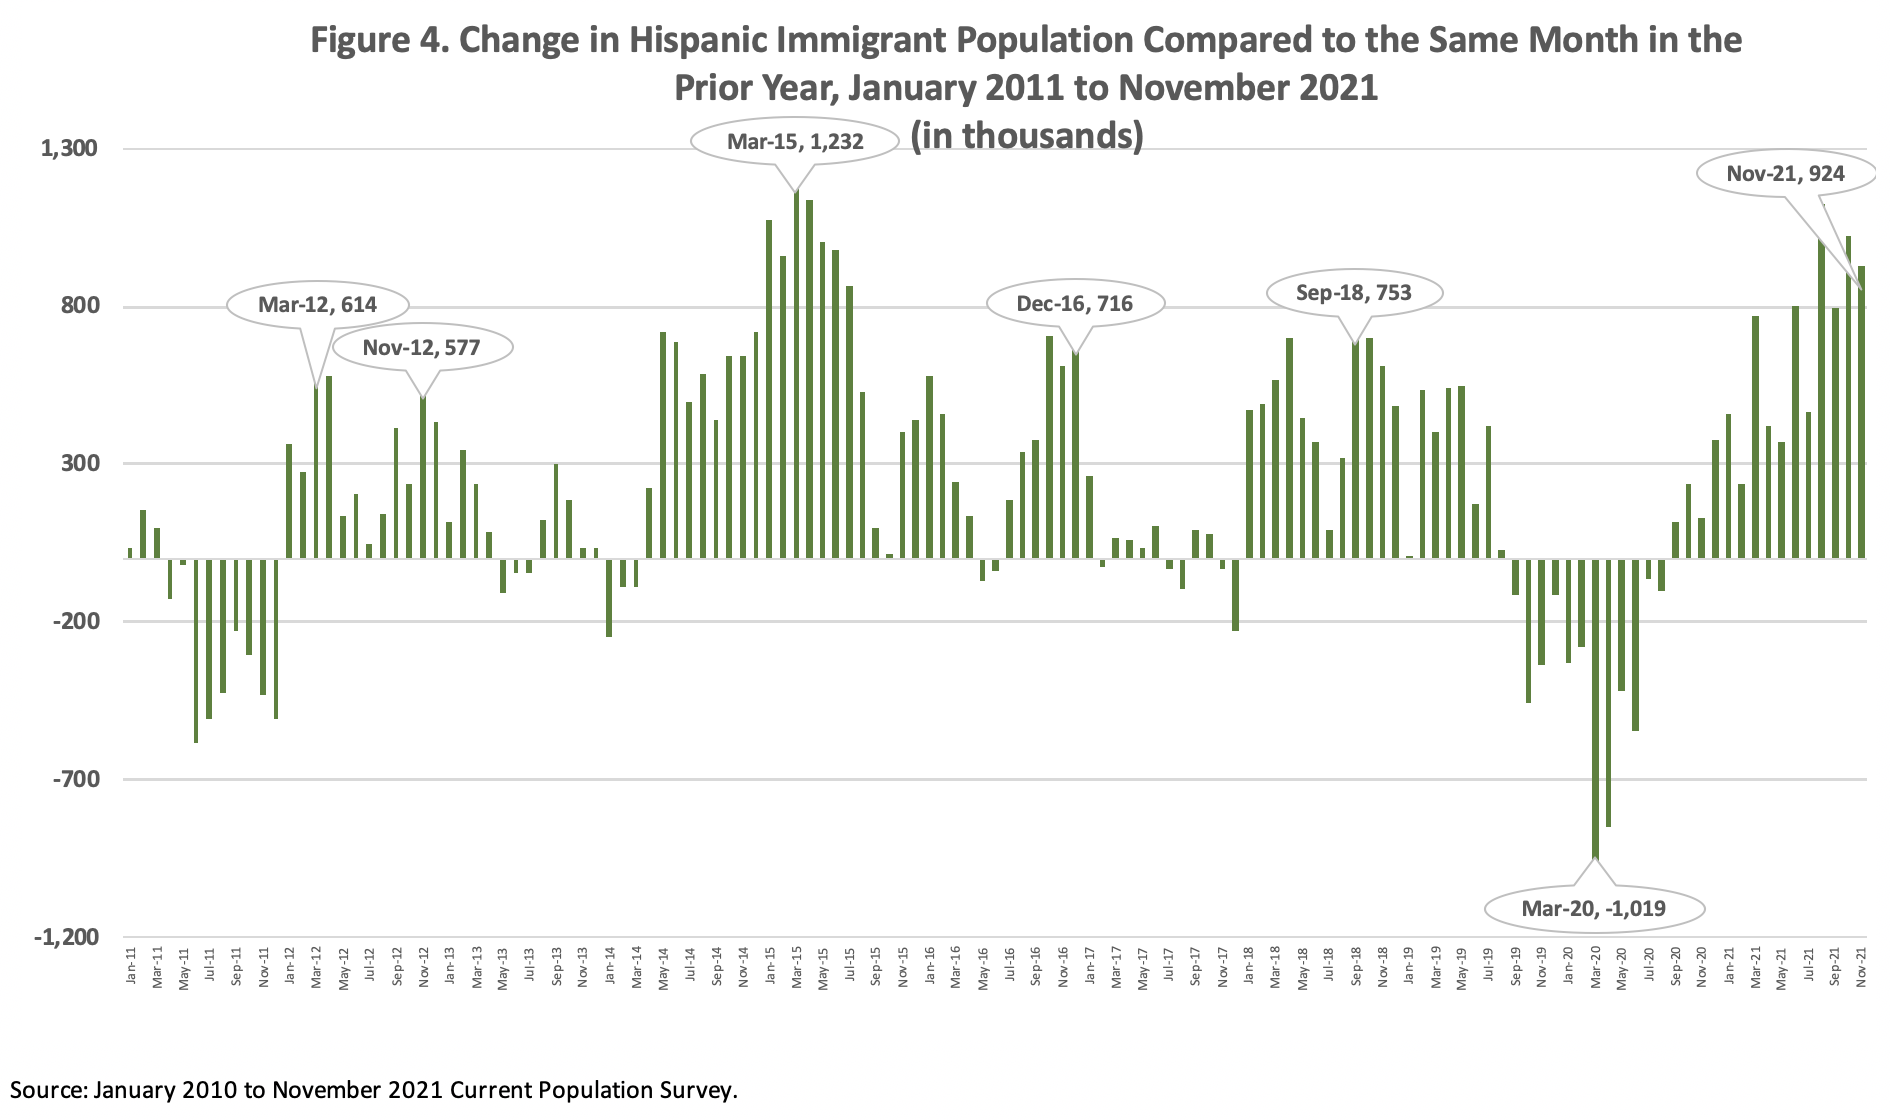
- Hispanic immigrants accounted for 924,000 or 61 percent of the growth since last November. This is an indication that illegal immigration accounts for a large share of the recent increase in immigrants. The federal government and outside researchers have estimated that nearly three-quarters of illegal immigrants in Census Bureau data are Hispanic.
- Between November 2020 and November 2021, the states with the largest increases in immigrants were Florida (up 615,000), California (up 451,000), Arizona (up 173,000), Wisconsin (up 156,000), and Virginia (up 135,000).
Definition of “Immigrants”. Although the term “immigrant” has a specific meaning in U.S. immigration law, which is all those inspected and admitted as lawful permanent residents, we use the term “immigrant” in this analysis in the non-technical sense to include all those who were not U.S.-citizens at birth. While there is some undercount in Census Bureau surveys like the Current Population Survey used here, the immigrant population includes naturalized citizens, lawful permanent residents, long-term temporary visitors (e.g. guestworkers and foreign students), and illegal immigrants. The Census Bureau refers to these individuals as the “foreign-born”, which we use synonymously with “immigrant” in this report. The foreign-born do not include those born to immigrants in the United States, including to illegal immigrant parents, or those born in U.S. territories, such as Puerto Rico.
Growth in the Immigrant Population. Figure 1 shows the total immigrant population (legal and illegal) from January 2010 to November 2021, along with margins of error. The figure shows that the nation’s immigrant population grew to 46.2 million in November 2021, a 1.5 million increase since November 2020. If we compare October 2020, right before the election, to November 2021, we find an increase of 2.2 million. Interestingly, in contrast to the 1.5 million increase in the immigrant population after Biden’s victory, in the year after Trump’s victory (November 2016 to November 2017) the immigrant population actually fell slightly. This is an indication that the policies and public statements of each administration had a significant impact.
 |
The foreign-born population can only increase in size due to new arrivals, so the large increases in the monthly CPS must be due to a significant increase in the number of newcomers settling in the country in the last year. Of course, net change in the size of the foreign-born also reflects the level of outmigration by legal and illegal immigrants. We have previously estimated out-migration at nearly one million annually. So the dramatic growth likely indicates that out-migration fell as well. Net changes in the number of immigrants are also impacted by natural mortality among the existing population of immigrants already in the county; however, this does not change significantly from year to year.
The growth in the last year follows a 1.2 million decline from February to September 2020. That decline almost certainly reflects the significant reduction in new legal and illegal immigration caused by Covid-19 restrictions on international travel, the suspension, for a time, of visa processing at American consulates overseas, the Remain in Mexico policy for asylum applicants, and Title 42 expulsions, which allowed the U.S. government to send illegal border-crossers immediately back to Mexico, even those not from that country. All of these factors, as well as others, significantly slowed the pace of new arrivals into the country. At the same time, some level of outmigration by immigrants, including deportations, continued during this time period as did natural mortality, causing the total immigrant population to fall through the middle of 2020.
The restarting of visa processing at American consulates has allowed many more permanent immigrants (green card holders) to arrive from abroad, as well as short-term (e.g., tourists) and long-term temporary visitors (e.g., guestworkers and students). The massive surge of illegal immigrants at the southern border caused in part by the perception, based on his campaign promises, that President Biden would curtail immigration enforcement explains at least some of the growth in the immigrant population we are seeing in the monthly CPS. The administration’s decision to suspend almost all deportations and the resulting huge decline in deportations, the ending of Remain in Mexico, the scaling back of Title 42 expulsions, and Congress’s continuing efforts to pass a bill legalizing illegal immigrants have all likely made illegal immigrants in the country feel safer and reduced out-migration, while encouraging new illegal immigration.
Figure 2 shows a year-to-year monthly comparison in the size of the immigrant population. The impact of Covid-19 restrictions can clearly be seen starting in the first part of 2020. The biggest year-to-year monthly decline was 1.6 million from March 2019 to March 2020. But the immigrant population fell to its smallest size of 43.8 million in August 2020. When compared to the same month in the prior years, Figure 2 shows that the immigrant population began to grow in December of 2020 and has continued to increase every month relative to the same month in the prior year through November of 2021.
 |
Illegal Immigration. Figure 3 shows the number of Hispanic immigrants in the country. Hispanic immigrants (legal and illegal), accounted for 920,000, or 61 percent, of the nearly 1.5 million increase since last November. Figure 4 shows year-to-year monthly changes in that population. Like the overall foreign-born population, Figures 3 and 4 show that the number of Hispanic immigrants fell significantly at the height of the Covid-19 epidemic before rebounding at the end of 2020 and then throughout 2021. The federal government and outside researchers have previously estimated that nearly three-quarters of illegal immigrants are Hispanic, so the recent increase in Hispanic immigrants can be seen as an indication that illegal immigration has increased significantly in the last year. It is important to note this refers to the share of illegal immigrants who are Hispanic, not the share of Hispanic immigrants who are illegally in the country. Of all Hispanic immigrants, roughly 35 percent are in the country illegally.
 |
 |
The Numbers in Historical Context. Immigration has risen and fallen throughout American history, and the number of immigrants in the country and their share of the population reflects this fact. Figure 5 shows the number of immigrants living in the country and their share of the total population from 1900 to 2021. It also shows the number of immigrants and their share of the population through 2060 based on Census Bureau projections. After reviewing the monthly CPS going back to 1994, when the foreign-born began to be identified on a regular basis, the American Community Survey (ACS) going back to 2000 when it began, and decennial census data back to 1850, when the foreign-born were first identified, we concluded that the 46.2 million immigrants in the November 2021 CPS is the largest number of immigrants ever recorded in American history in any census or survey collected by the government.1
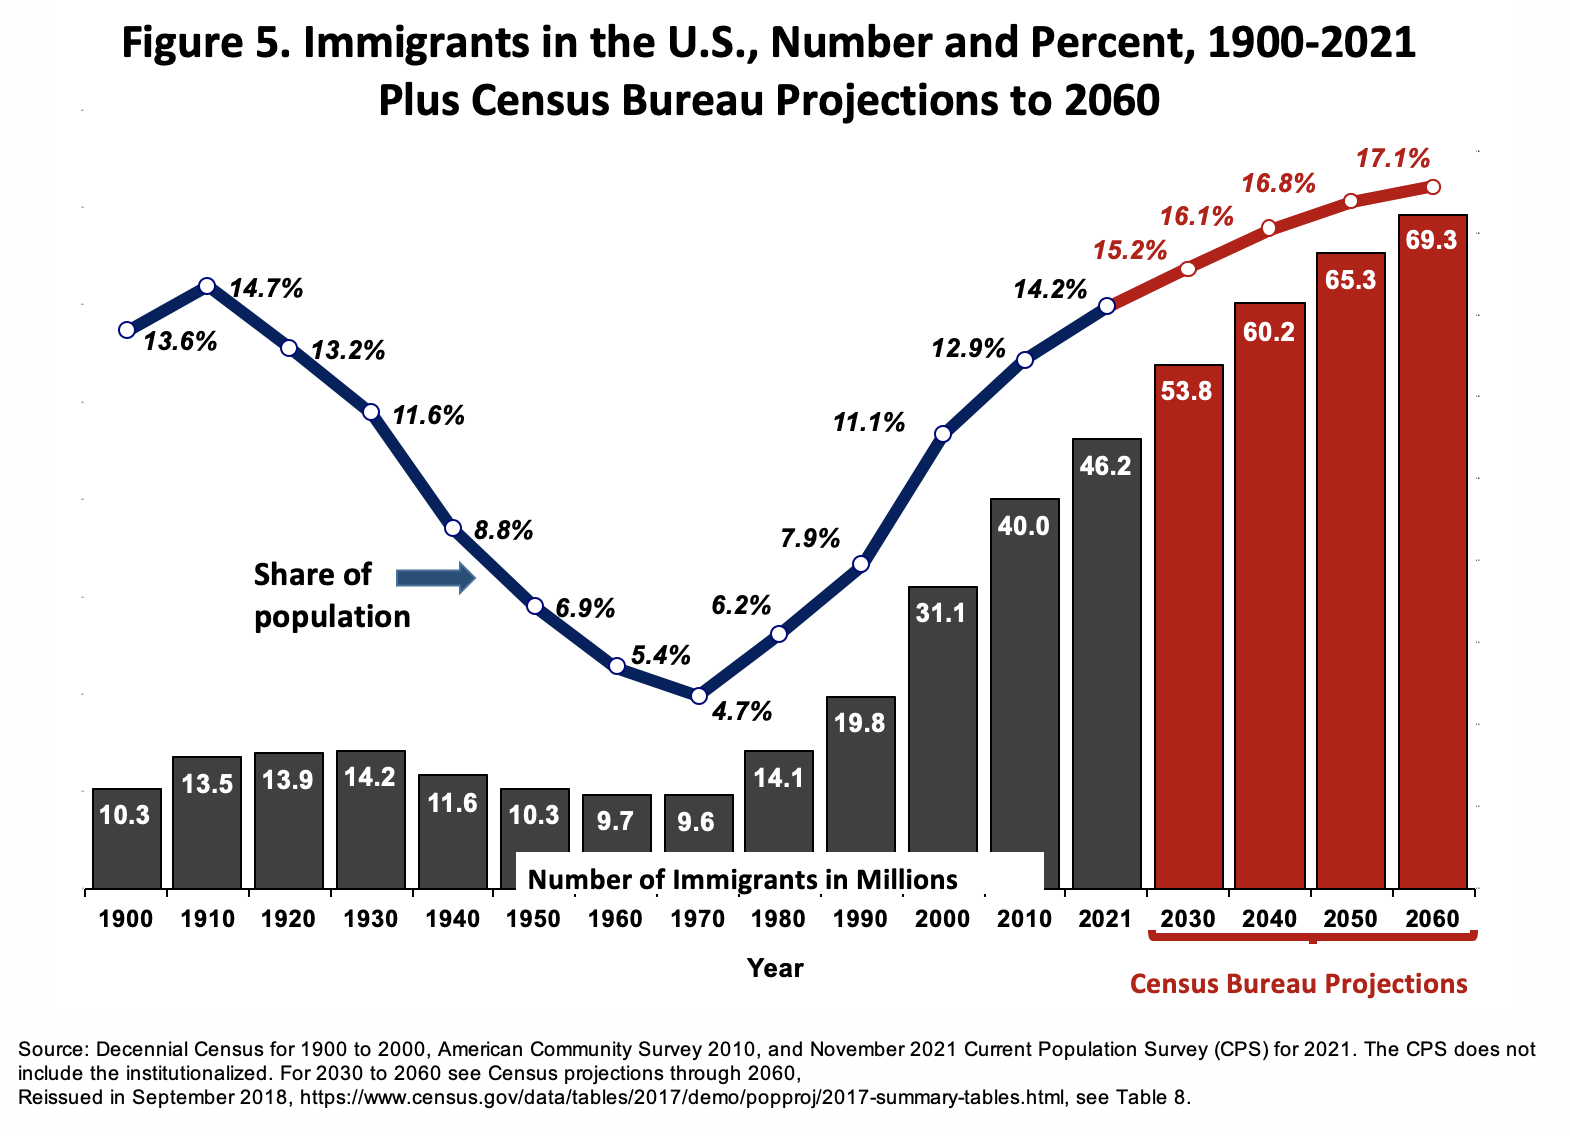 |
The 14.2 percent shown in the November CPS is the highest percentage recorded in any government survey or census since 1910 when, as Figure 5 shows, it was 14.7 percent. In 1890 the share was very similar at 14.8 percent. Moreover, the immigrant share is on track to surpass these all-time highs in the next few years based on Census Bureau projections. Of course, this assumes immigration levels will remain extremely high. There is one caveat about the percentage figures: The CPS only includes the non-institutionalized civilian population, while the ACS and census data to which it is compared in Figure 5 is for the entire population. Immigrants are a smaller share of the military and the institutionalized population than they are of the non-institutionalized civilian population. If the total population used as the denominator to calculate the immigrant percentage included institutionalized civilians, then immigrants would likely be a slightly lower percentage of the total population in the November 2021 CPS. But the effect would be quite small.2 It may be worth adding that while the March 2019 CPS showed a smaller number of immigrants (45.8 million), the foreign-born share in that month was also about 14.2 percent because the overall size of the U.S. population was somewhat smaller at that time.
Changes at the State Level. Unfortunately, the sample size of immigrants in the monthly CPS is quite modest in many states. So the survey is not well suited to measuring changes in the foreign-born population at the state level over the course of a single year. Nonetheless, if we compare the November 2020 CPS to the November 2021 CPS we do find that the five states with the largest increases were Florida (up 615,000), California (up 451,000), Arizona (up 173,000), Wisconsin (up 156,000), and Virginia (up 135,000).
About the CPS Data. The CPS is collected each month by the U.S. Census Bureau for the Bureau of Labor Statistics, with the primary purpose of measuring conditions in the U.S. labor market, such as the unemployment rate. It is sometimes called the “household survey” by the BLS to distinguish it from the survey of employers each month that measures job growth.
While the CPS sample size is large, it still has a relatively large numerical margin of error of roughly ±500,000 for the foreign-born, assuming a 90 percent confidence level. So numerical fluctuations from month to month can be quite large, making it necessary to compare large changes over longer periods of time when drawing conclusions about trends. The margins of error shown in Figures 1 and 3 are based on standard errors calculated using parameter estimates, which reflect the survey’s complex design. Neither the BLS nor the Census Bureau has provided parameter estimates for the general population for the monthly CPS, so we use those for the labor force.
It should also be noted that, like virtually all modern surveys, the CPS is weighted to reflect the total population by age, race, sex, and Hispanic origin. Each January, the weights used in the CPS, also called population controls, are re-adjusted to reflect updated figures on births, deaths, and net international migration. The update in January 2021 adjusted the size of the U.S. population slightly downward for January 2021 from December 2020, including the number of Hispanics and Asians. This should have reduced growth in the foreign-born slightly. Yet, the CPS still shows very substantial growth in the number of immigrants after this adjustment.
Potential Problems with the CPS. As already mentioned, the Census Bureau collects the monthly CPS for the Bureau of Labor Statistics (BLS). The BLS reports potential problems with collecting the CPS since March 2020 because of the Covid-19 pandemic. The largest issue that relates to this analysis is that response rates from March 2020 through November 2021 for the CPS were lower than prior to Covid-19, though rates have improved since hitting a low in June 2020. These lower rates increase the sampling error of the survey. It is not known if this problem had any impact on estimates of the foreign-born in the data. However, in June 2020, when the problem was most pronounced, the BLS stated that “Although the response rate was adversely affected by pandemic-related issues, BLS was still able to obtain estimates that met our standards for accuracy and reliability.” While there is no reason to doubt the accuracy of the foreign-born numbers in the monthly CPS, it is possible that some of the growth in the immigrant population since the middle of 2020 reflects better data collection by the Census Bureau as the pandemic lessened. Of course, this would not impact the record number of immigrants shown in the November 2021 CPS.
The Census Bureau’s Other Survey. Consistent with the monthly CPS, the Census Bureau’s much larger American Community Survey (ACS) from 2020 also shows a significant decline in the foreign-born population between 2019 and 2020. However, the ACS is an annual survey controlled to a July 1 date and therefore it does not reflect the restarting of legal immigration or the border crisis that began after July 2020. The 2021 ACS is still being collected and will not be released until September 2022. Moreover, the Census Bureau reports it had significant problems collecting the 2020 ACS due to disruptions caused by Covid-19. The Census Bureau states that it was “unable to collect information from certain segments of the population” for the ACS in 2020, particularly lower-income and less-educated individuals. Although the data from the 2020 ACS is available online, the Bureau has only put out a limited number of tables from it and they have published a detailed analysis showing some of the problematic results in the 2020 ACS. But even if there were no problems with the 2020 ACS, it still would be more than a year out of date at this point. The monthly CPS indicates that, with regard to immigrants, things have changed profoundly since the middle of 2020.
End Notes
1 The 1850 Census was the first to identify the foreign-born population as we understand it today: persons who are not U.S. citizens at birth. In 1820 and 1830 the Census identified foreigners not naturalized. In addition to the decennial Census, American Community Survey, and monthly CPS, there is the Current Population Survey Annual Social and Economic Supplement (CPS ASEC), which is also commonly used to measure the immigrant population. The CPS ASEC uses the monthly March CPS and then oversamples minorities and also asks respondents a series of additional questions. It is one of the country’s primary sources of information on poverty, income, and health insurance coverage, among other things. Due to its unique design, the CPS ASEC often shows a larger immigrant population than the basic March CPS. The previous largest foreign-born populations ever in the CPS ASEC were 45.8 in 2019 and 44.9 million and 44.8 million in 2020 and 2021, respectively. All of the results of the CPS ASEC are lower than the 46.2 million the November CPS.
2 We can gauge the impact of including the institutionalized in the denominator by looking at the public-use Census Bureau’s annual American Community Survey (ACS), which does include the entire population. In 2019, immigrants (legal and illegal) were 13.64 percent of the total population in the ACS when the institutionalized were included and 13.72 percent when they are not included — less than one-tenth of a percentage-point difference. The distribution of immigrants across the institutionalized and non-institutionalized changes almost not at all from year to year so the foreign-born share of the population in November 2021 might have been about one-tenth of 1 percent lower if the entire population was used as the denominator.
