Expanded from a January 29, 2018, National Review Online article.
President Trump's alleged derogatory comments about some African counties have sparked interest in immigrants from those countries to the United States. As the Census Bureau data below makes clear, immigrants from Sub-Saharan Africa are well educated and most do reasonably well.*
However, decades ago when this population was much smaller, it was also much more educated. In those days most came as foreign students or to fill skilled jobs. This produced a population much more educated than native-born Americans. Over time, as family-based chain migration began to dominate the flow of new arrivals, along with the visa lottery and refugee resettlement, the education level of this population declined dramatically relative to the native-born.
As a result, a significant share of immigrants from this part of the world now struggle in the United States. To be sure, Sub-Saharan Africans are still more likely to have a bachelor's degree than the native-born. But it is no longer the case that this group is dramatically more educated than natives.
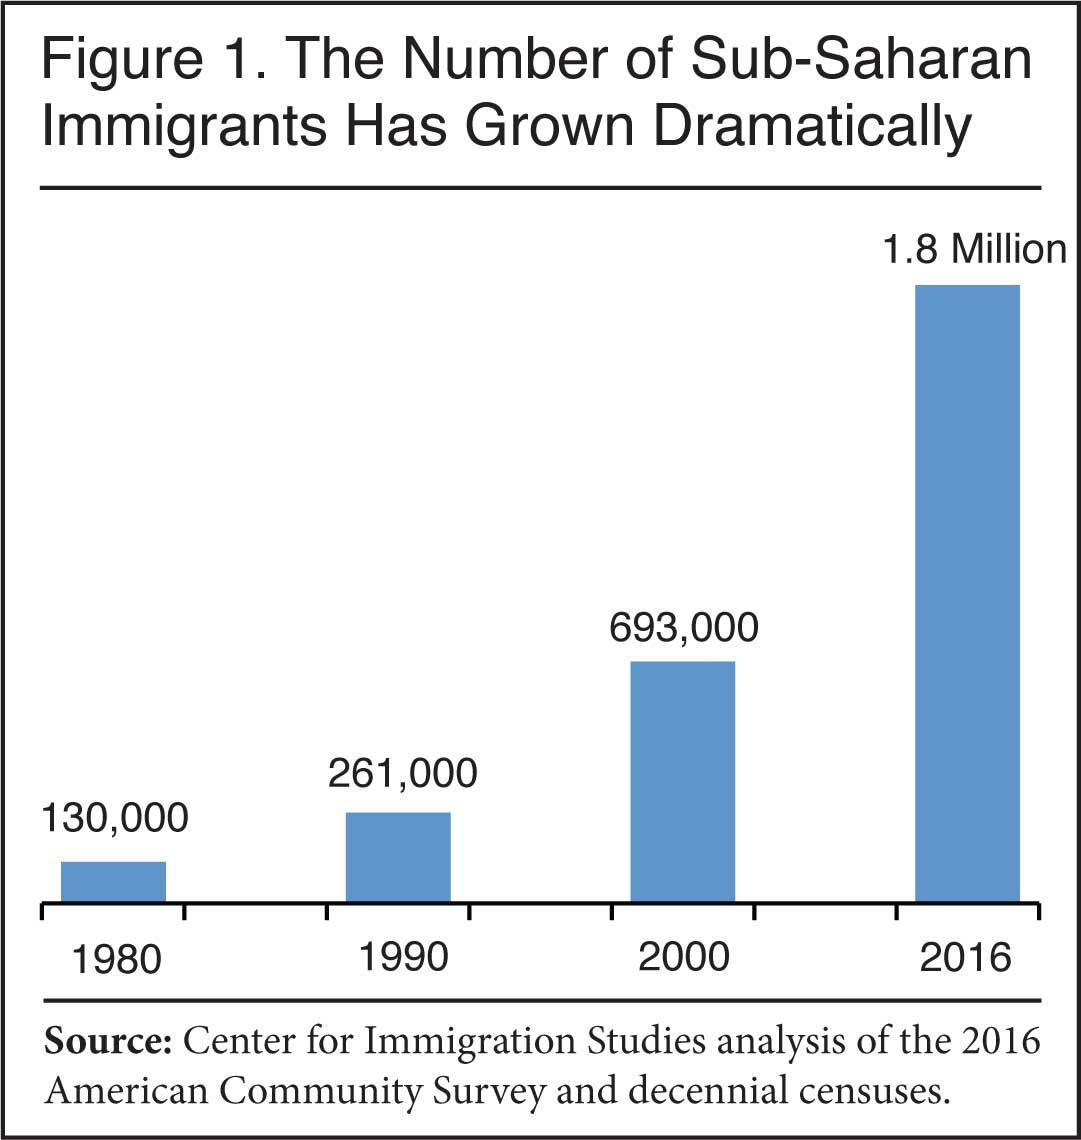
The top of Table 1 and Figure 1 report the number of immigrants from Sub-Saharan Africa. The growth in this population has been nothing short of extraordinary. Since 2000 it has increased by 250 percent. Since 1990, it has increased nearly seven-fold and it has grown almost 14-fold since 1980. The bottom of Table 1 and Figure 2 also report the share of immigrants from this part of world who have not completed high school or who have at least a bachelor's degree. (All education figures are for persons 25 to 65 years of age.)
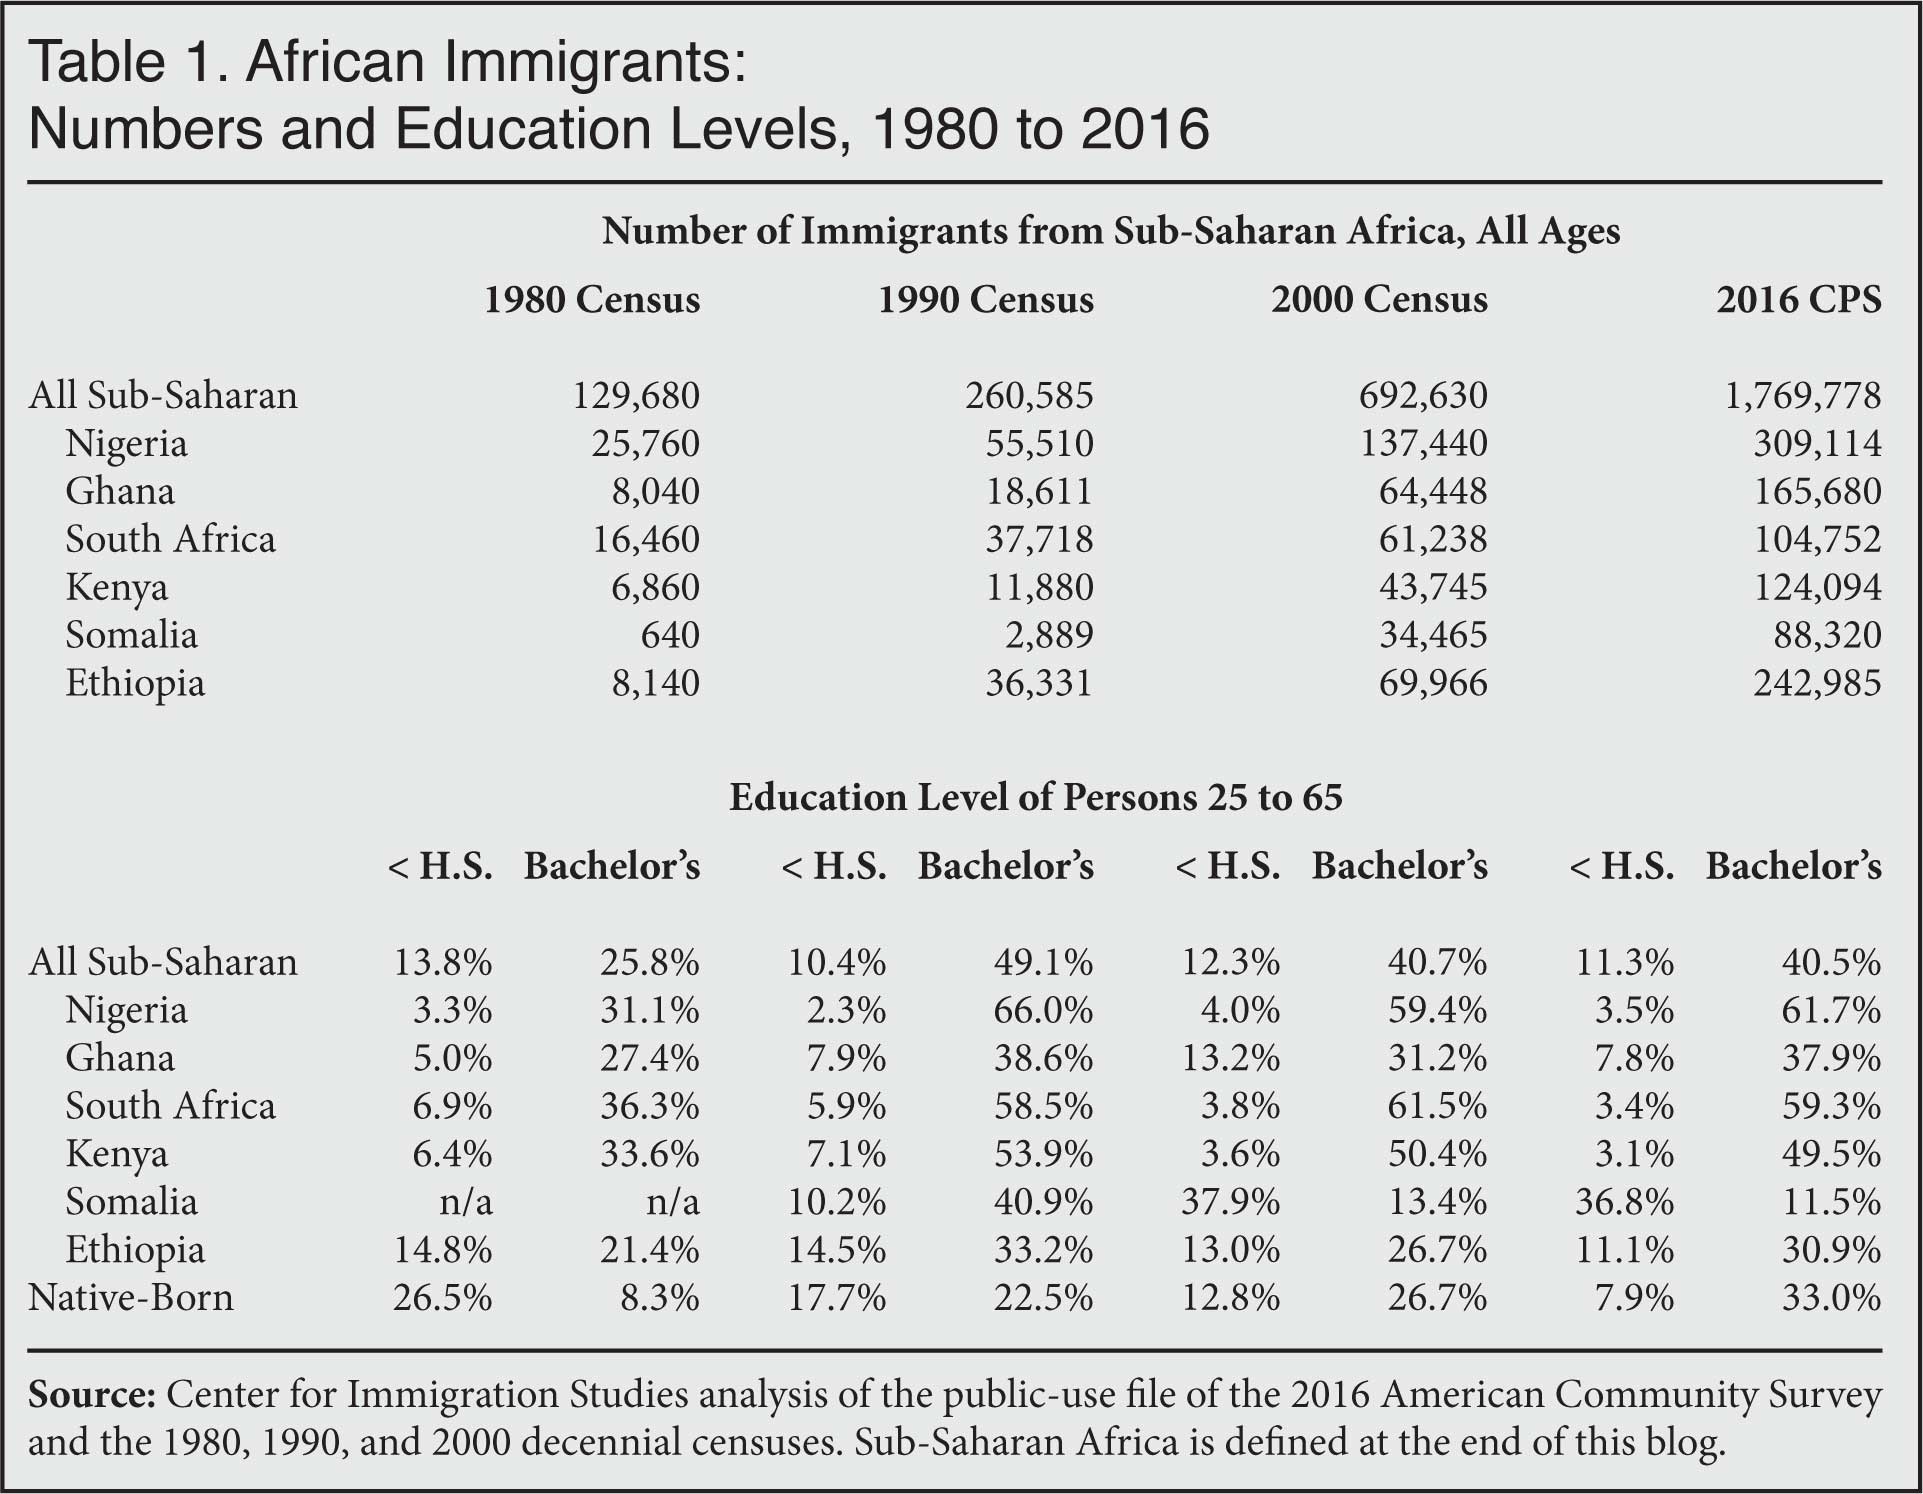
In terms of education, the bottom part of Table 1 and Figures 2 and 3 show that in 2016 immigrants from Sub-Saharan Africa are more likely to lack a high school degree (11.3 percent) than the native born (7.9 percent), but they are also more likely to have at least a bachelor's degree — 40.5 percent vs. 33 percent. Immigrants from Sub-Saharan Africa are also relatively well educated compared to immigrants generally. Overall, about 27 percent of immigrants (25 to 65) in America (legal and illegal) have not completed high school and roughly 31 percent have at least a college degree.
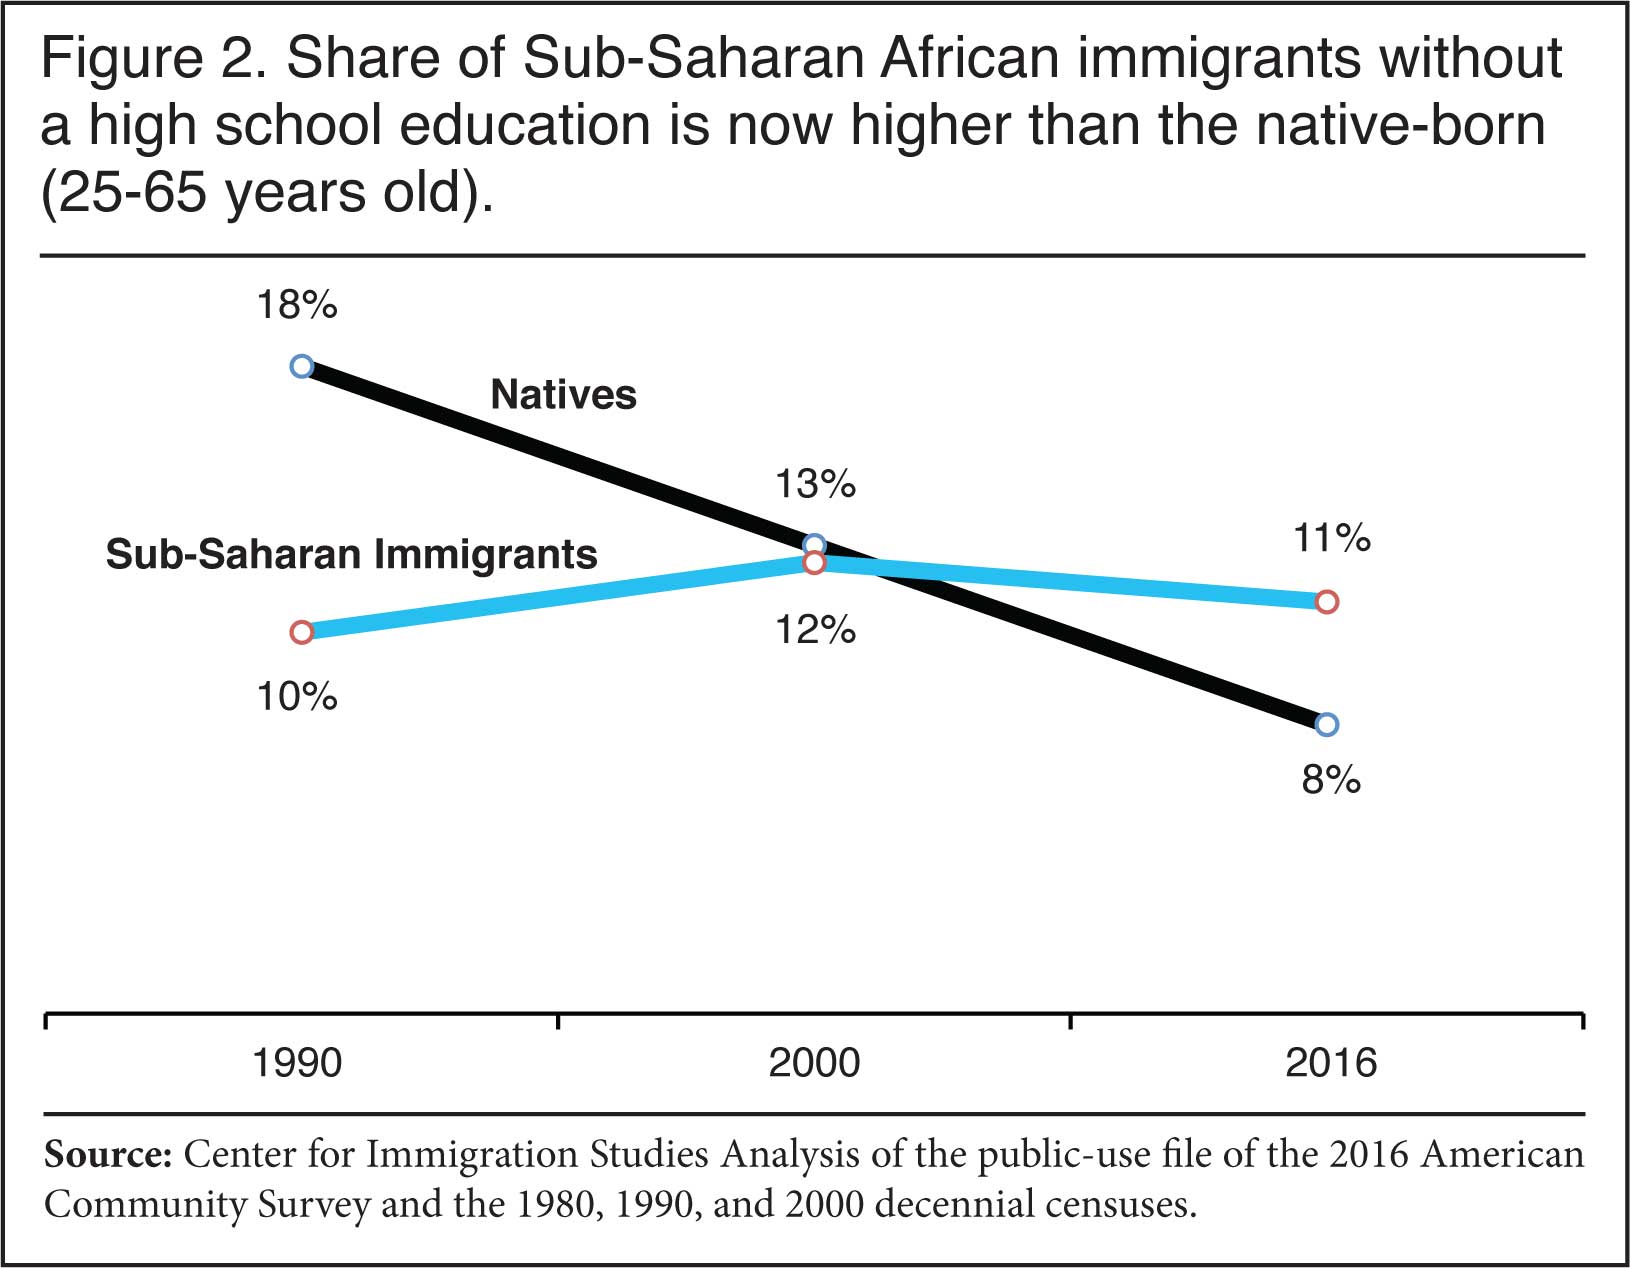
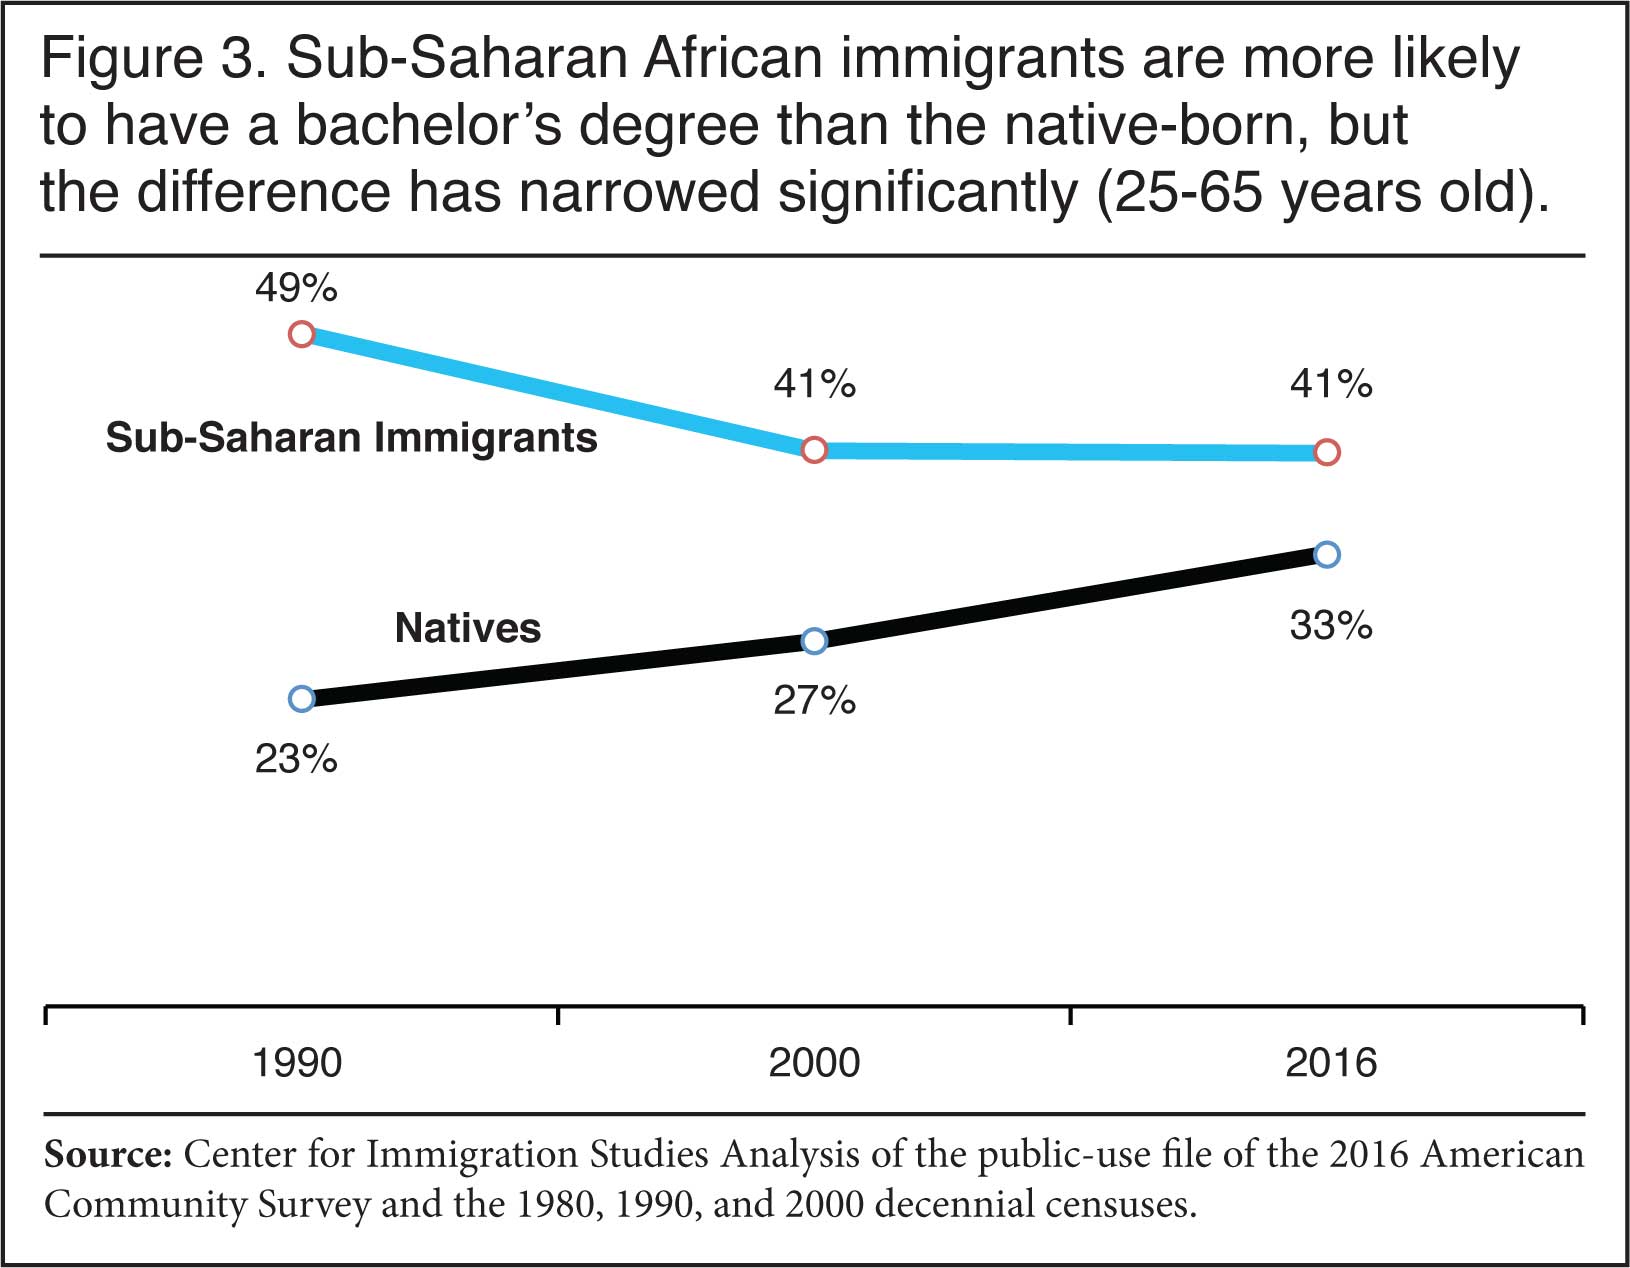
However, as Table 1 and Figure 1 show, the education level of Sub-Saharan African immigrants has declined significantly relative to native-born Americans. As recently as 1990, these immigrants were more likely to have completed high school than natives, and were more than twice as likely as natives to have a college degree. But this is no longer the case. Africans are now less likely to have completed high school than natives. At the top of the educational distribution Sub-Saharan Africans enjoyed nearly a 27 percentage-point advantage over natives in the share with at least a bachelor's degree in 1990. By 2000, this had narrowed to 14 percentage points; and in 2016 it was less than eight percentage points. As the flow of African immigrants has shifted to those coming under the chain migration provisions, the visa lottery, or as refugees, and away from foreign students and skilled immigrants, their relative education has declined.
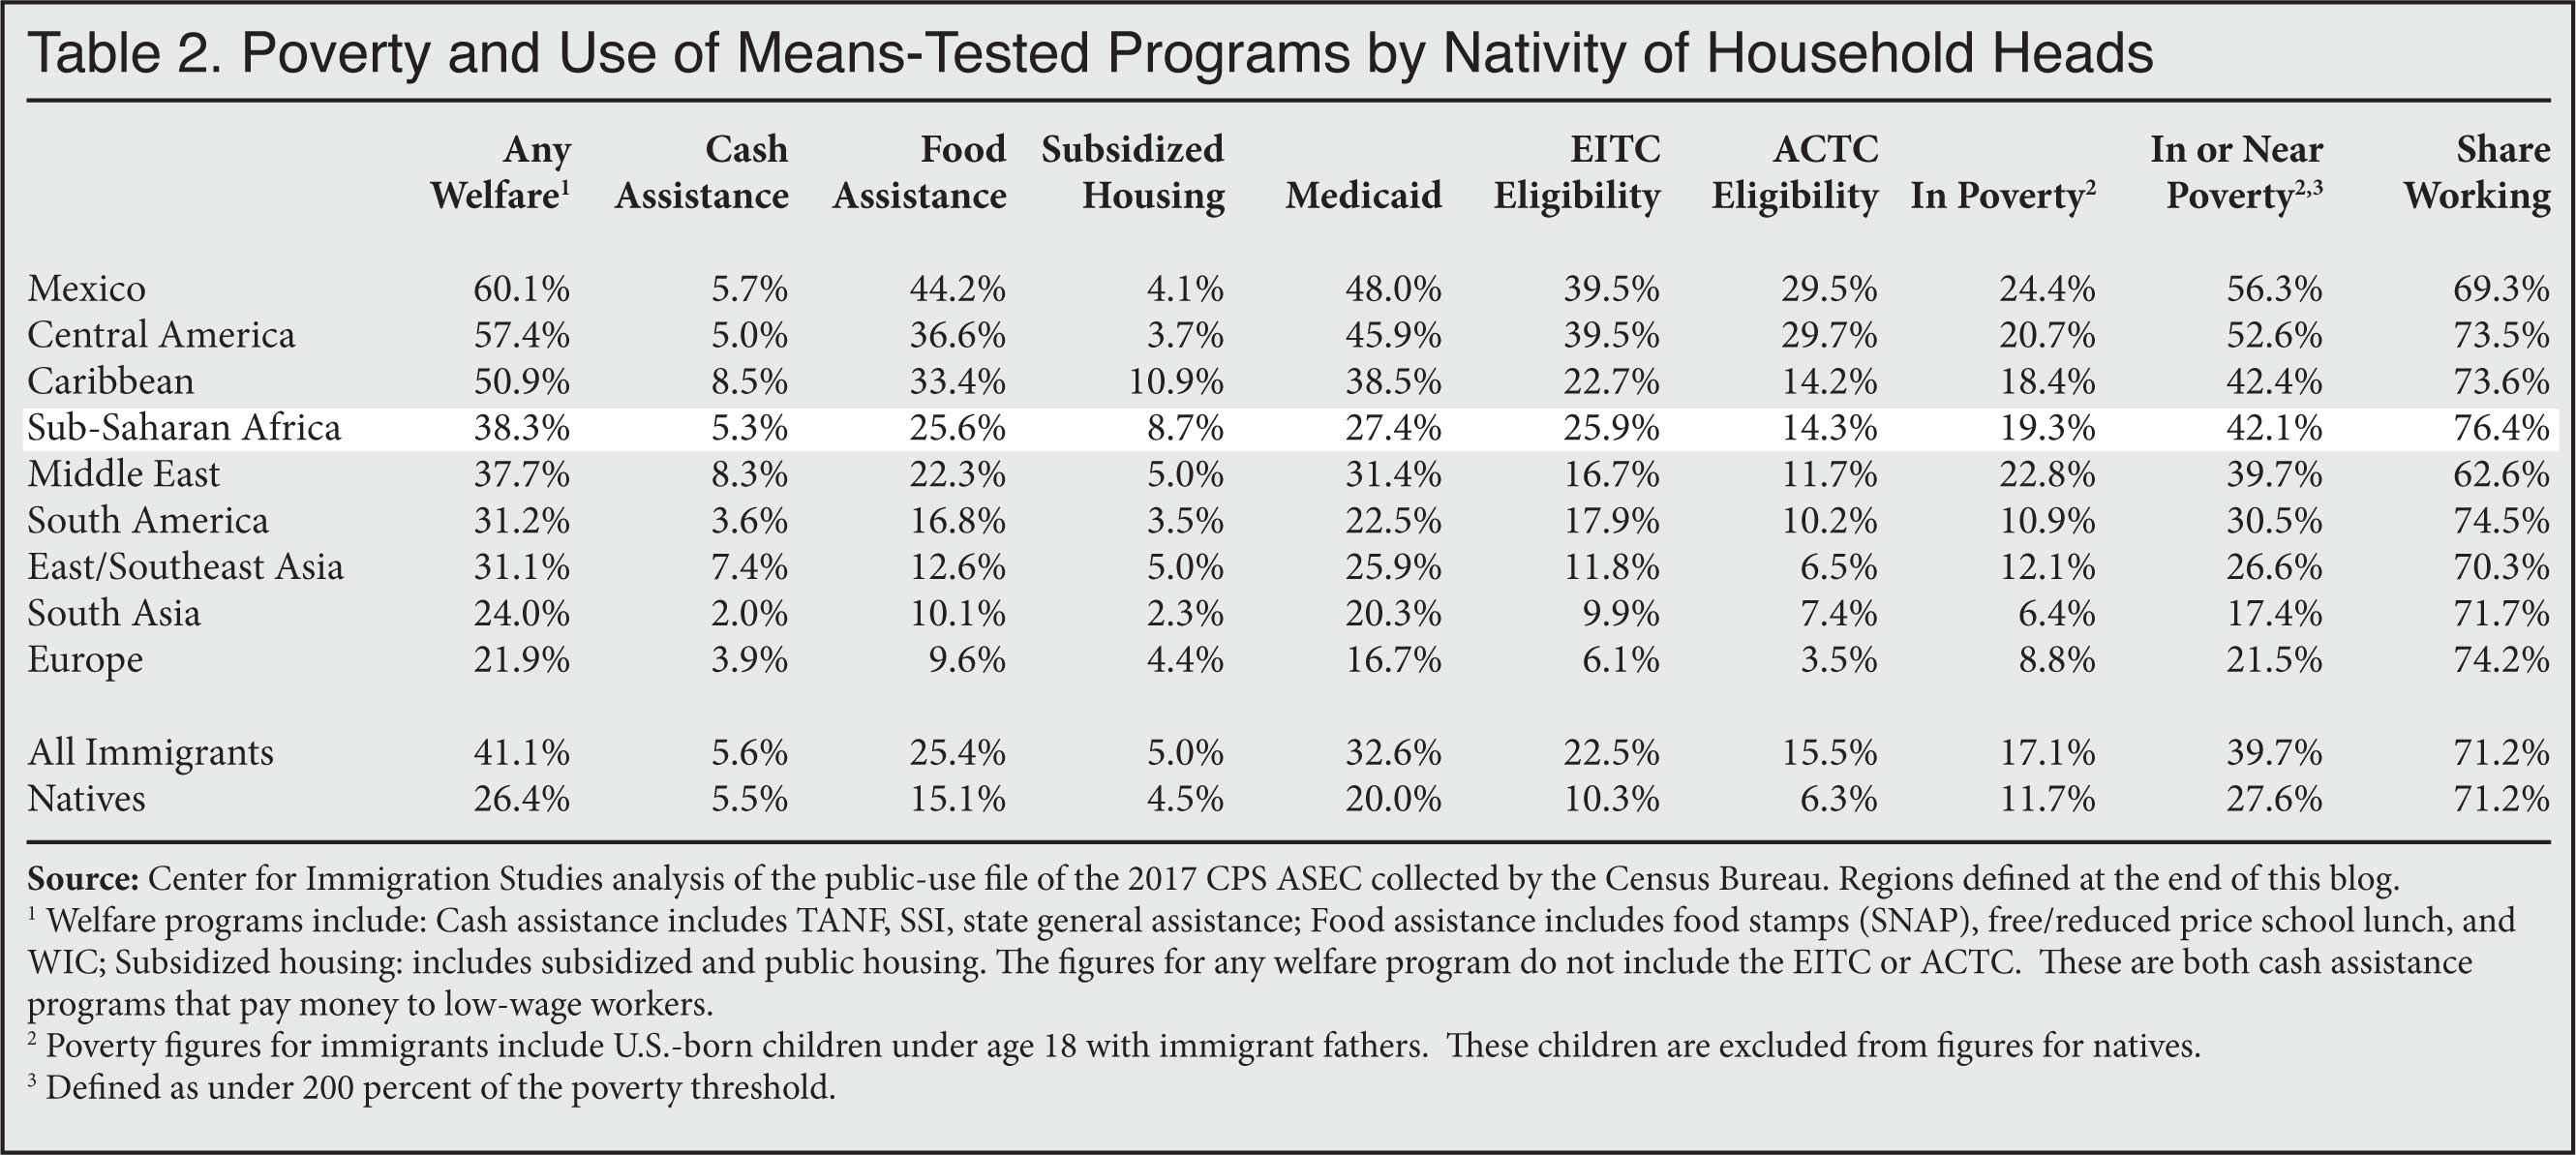
Education is one of the best predictors of how immigrants will do in the United States. Given the education level of African immigrants, most should still do well in the United States. However, Table 2 shows that in terms of poverty, near poverty, and welfare use, many immigrants from Sub-Saharan Africa do struggle. Of course, it must be emphasized that in recent years Africa has been one of the top refugee-sending regions. Refugees have immediate access to all welfare programs. This helps to explain why 38.3 percent of households from this part of the world access one or more welfare programs, even though they are more likely to have a college degree than natives, 26.4 percent of whom access welfare. While high, the 38.3 percent of Sub-Saharan African immigrant households using welfare is actually slightly lower than the 41.1 percent for all immigrant households. It must also be emphasized that their high welfare use rates are not caused by low rates of work. Table 2 shows that African immigrants are more likely to have a job than immigrants generally or the native-born. Although most work, (76.4 percent), many still cannot support themselves or their children and turn to taxpayers and the welfare system.
In terms of the share in poverty or in or near poverty, Table 2 shows that the rates for Sub-Saharan African immigrants are a good deal higher than for natives, and more similar to immigrants overall. The share in or near poverty (<200 percent of poverty) as shown in Table 2 is 42.1 percent. This is a reasonable measure of prosperity, as those with income below this level generally pay no federal income tax and are often eligible for means-tested programs. Those above 200 percent of poverty can be seen as middle or even upper class, which would mean that 57.9 percent of African immigrant are middle class or above. This compares to 72 percent of natives.
When it comes to immigration, stereotypes often drive the debate. The Census Bureau's survey on which this data is based shows a complex and changing picture when it comes to immigrants from Sub-Saharan Africa. In some ways it is a relatively highly educated population, a significant share of whom can be said to be middle class. On the other hand, relative to natives, the education level of this population has declined significantly. This decline almost certainly reflects the change in the way many of these immigrants come to the United States. Those admitted as the family members of naturalized citizens, or through the visa lottery, or as refugees now dominate the flow of new arrivals. As a result, the education level of this population has declined significantly in the past three decades. There is nothing surprising about this finding. How immigrants enter the United States has enormous implications for their likely skill levels and how they will do once here. It seems likely that if chain migration, the visa lottery, and refugee resettlement continue to dominate Sub-Saharan African immigration, the education level of immigrants will continue to decline relative to the native-born.
* In Table and Figure 1, which are based on the American Community Survey, Sub-Saharan Africa includes the following countries: Cape Verde, Ghana, Guinea, Liberia, Nigeria, Senegal, Sierra Leone, Ethiopia, Kenya, Somalia, Tanzania, Uganda, Zimbabwe, Eritrea, Cameroon, South Africa, Zaire, Congo, Zambia, Togo, The Gambia, and Africa and Western and Eastern Africa not specified.
In Table 2, which is based on the 2017 Annual Social and Economic Supplement of the Current Population Survey regions are defined as follows: Central America: Belize, Costa Rica, El Salvador, Guatemala, Honduras, Nicaragua, Panama; South America: Argentina, Bolivia, Brazil, Chile, Colombia, Ecuador, Guyana, Paraguay, Peru, Uruguay, Venezuela, South America not specified; South Asia: Afghanistan, Bangladesh, Bhutan, India, Nepal, Pakistan, Sri Lanka; East Asia: Myanmar (Burma), Cambodia, China, Hong Kong, Indonesia, Japan, Korea, South Korea, Laos, Malaysia, Mongolia, Philippines, Singapore, Taiwan, Thailand, Vietnam, Asia not specified; Europe: Albania, Austria, Belgium, Bulgaria, Czechoslovakia, Denmark, Finland, France, Germany, Greece, Hungary, Iceland, Ireland, Italy, Netherlands, Norway, Poland, Portugal, Azores, Romania, Spain, Sweden, Switzerland, United Kingdom, England, Scotland, Northern Ireland, Yugoslavia, Czech Republic, Slovakia, Bosnia & Herzegovina, Croatia, Macedonia, Serbia, Estonia, Latvia, Lithuania, Armenia, Belarus, Georgia, Moldova, Russia, Ukraine, USSR, Montenegro, Europe not specified; Caribbean: Bermuda, Antigua and Barbuda, Bahamas, Barbados, Cuba, Dominica, Dominican Republic, Grenada, Haiti, Jamaica, St. Kitts-Nevis, St. Lucia, St. Vincent and the Grenadines, Trinidad and Tobago, West Indies not specified; Middle East: Azerbaijan, Iran, Iraq, Israel, Jordan, Kazakhstan, Kuwait, Lebanon, Saudi Arabia, Syria, Turkey, United Arab Emirates, Uzbekistan, Yemen, Algeria, Egypt, Libya, Morocco, Sudan; Sub-Saharan Africa: Cameroon, Cape Verde, Congo, Ethiopia, Eritrea, Ghana, Guinea, Ivory Coast, Kenya, Liberia, Nigeria, Senegal, Sierra Leone, Somalia, South Africa, Tanzania, Togo, Uganda, Zaire, Zambia, Zimbabwe, Africa Not Specified.