Over at Aporia magazine, Noah Carl used the General Social Survey (GSS) to examine the political preferences of different American ancestry groups. “There is a relatively clear pattern,” he concluded. “Americans of Northern European origin are the most conservative; those of Southern and Eastern European origin are intermediate; and those of Asian, African, or Mexican origin are the least conservative.”
This result is striking when viewed through an immigration lens. Leave aside the African-origin respondents for a moment because most of them were never immigrants. Now notice that conservatism seems to correlate with how long ago each ancestry group had its major period of migration. The most conservative group, Northern and Western (NW) Europeans, constituted most of the settlers and early immigrants who founded the United States. The intermediate group, Southern and Eastern (SE) Europeans, came primarily during the 1880-1920 Great Wave. Meanwhile, most of the U.S. Asian and Latin-American-descended populations arrived after 1965, and they are the least conservative groups.
To quantify the link between an ancestry group’s conservatism and its “tenure” (for lack of a better term) in the U.S., I re-analyzed the GSS data that Noah Carl used. I first replicated his findings on ancestry-level conservatism, and then I searched for a way to measure tenure. Identifying each group’s peak year of migration would be ideal, but information on the foreign-born population is scant prior to the Civil War, and in some cases it would be difficult to align the ancestry group categories in the GSS with birth countries. (An ethnically Polish immigrant in the 19th century, for instance, may have been born in Germany or Russia.)
I decided to measure each ancestry group’s tenure by how many U.S.-born grandparents its members report in the GSS. Close to 100 percent of the most tenured groups’ grandparents will be U.S.-born, while more recent arrivals will have less.
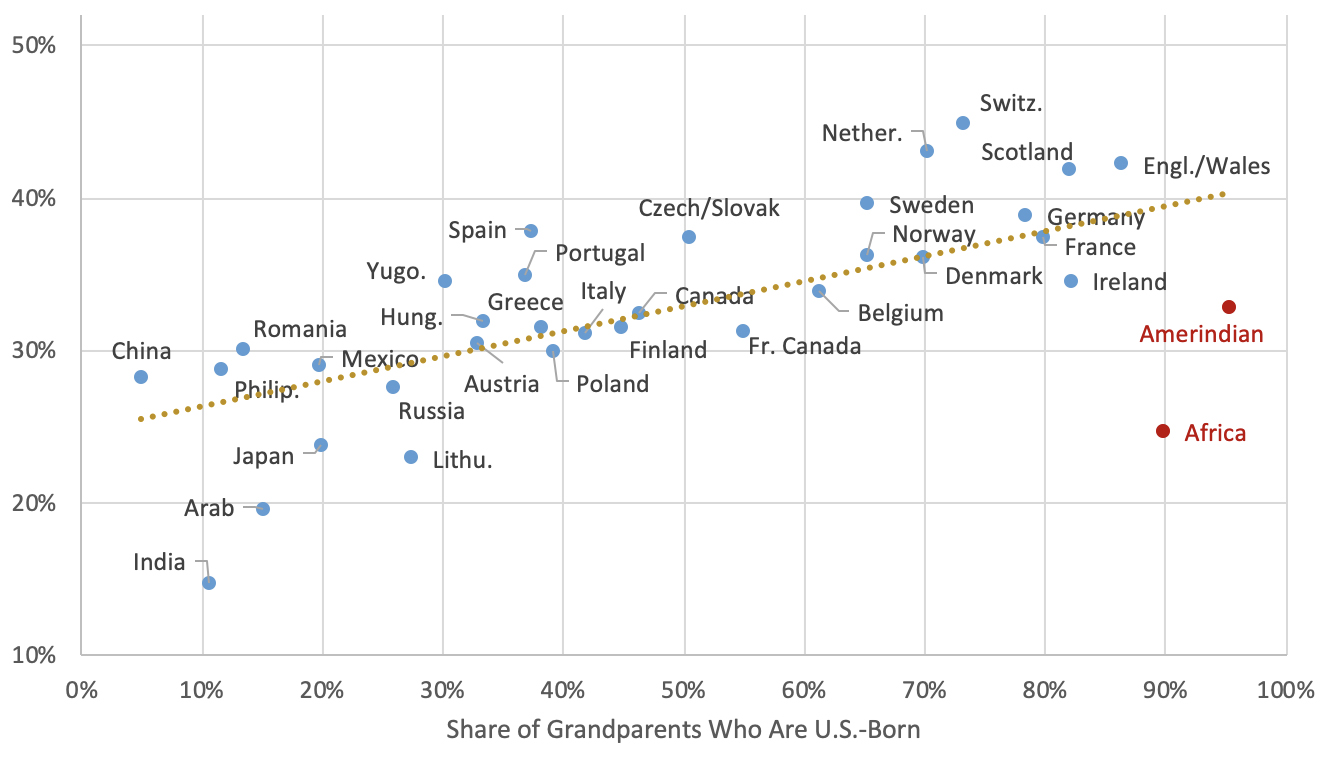
Figure 1 places each major ancestry group on a scatterplot, where the vertical axis is percentage conservative, and the horizontal axis is tenure as measured by U.S.-born grandparents. For example, 36 percent of individuals who cite Norwegian ancestry are conservatives, while 65 percent of the Norwegians’ grandparents (averaged together) were U.S.-born.
Figure 1. Share of Conservatives Within American Ethnic Groups |
 |
|
Source: General Social Survey, 1972-2022 r = 0.65; without the two outliers, r = 0.80. |
The overall plot is remarkably tight, with longer-tenured groups consistently more conservative. The two major outliers are American Indians and Blacks, both of whom are much less conservative than their long tenures would predict. As noted above, few members of these groups were ever immigrants, which makes them less relevant to this analysis.
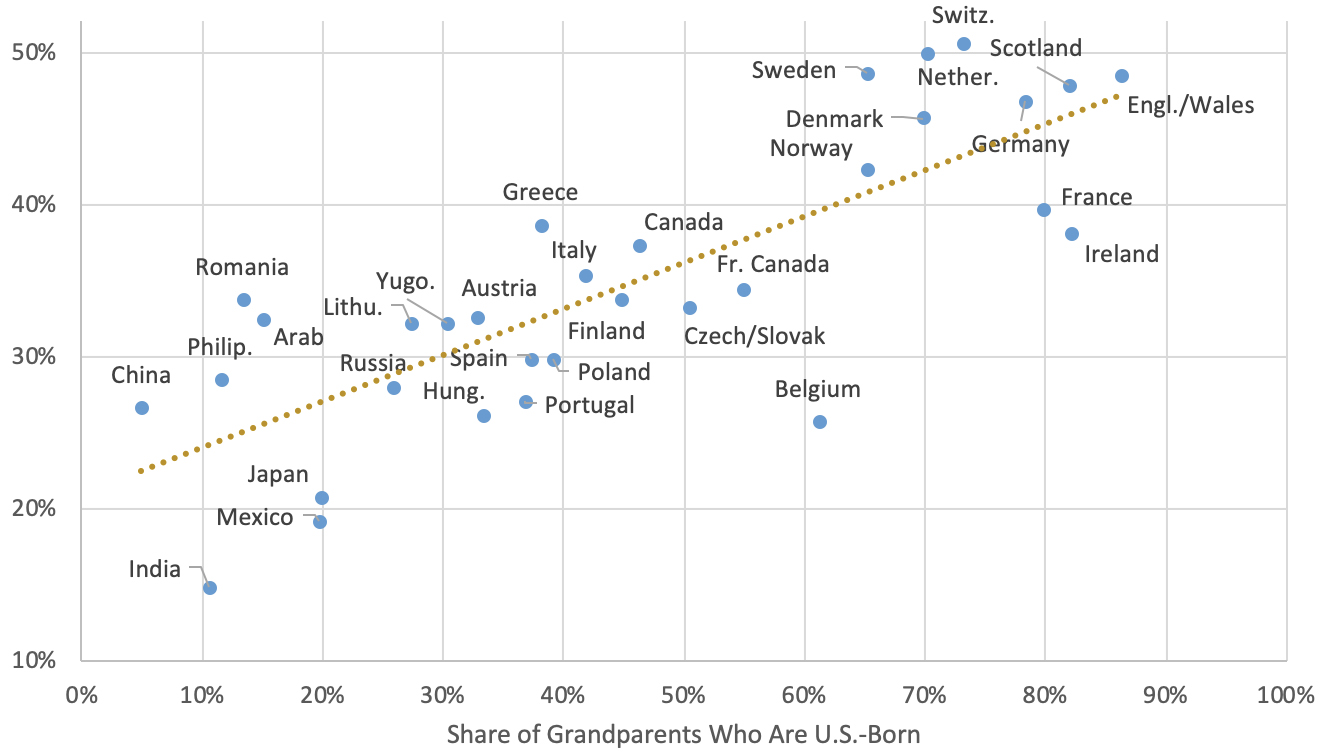
To analyze the political impact of immigration more directly, Figure 2 removes the two outliers and changes the vertical axis from conservatism to Republican party identification. The correlation is again strong, and the slope is now even steeper than in Figure 1.
Figure 2. Share of Republicans Within American Ethnic Groups |
 |
|
Source: General Social Survey, 1972-2022 r = 0.80. |
Both figures display in stark relief how newcomers tend to lean left. The idea that immigrants are “natural Republicans”, as some advocates on the right are wont to say, simply does not comport with the data or the history. Although exceptions exist — Republican-voting Cuban exiles come to mind — experience teaches that mass immigration will bolster the ranks of the most progressive Americans.
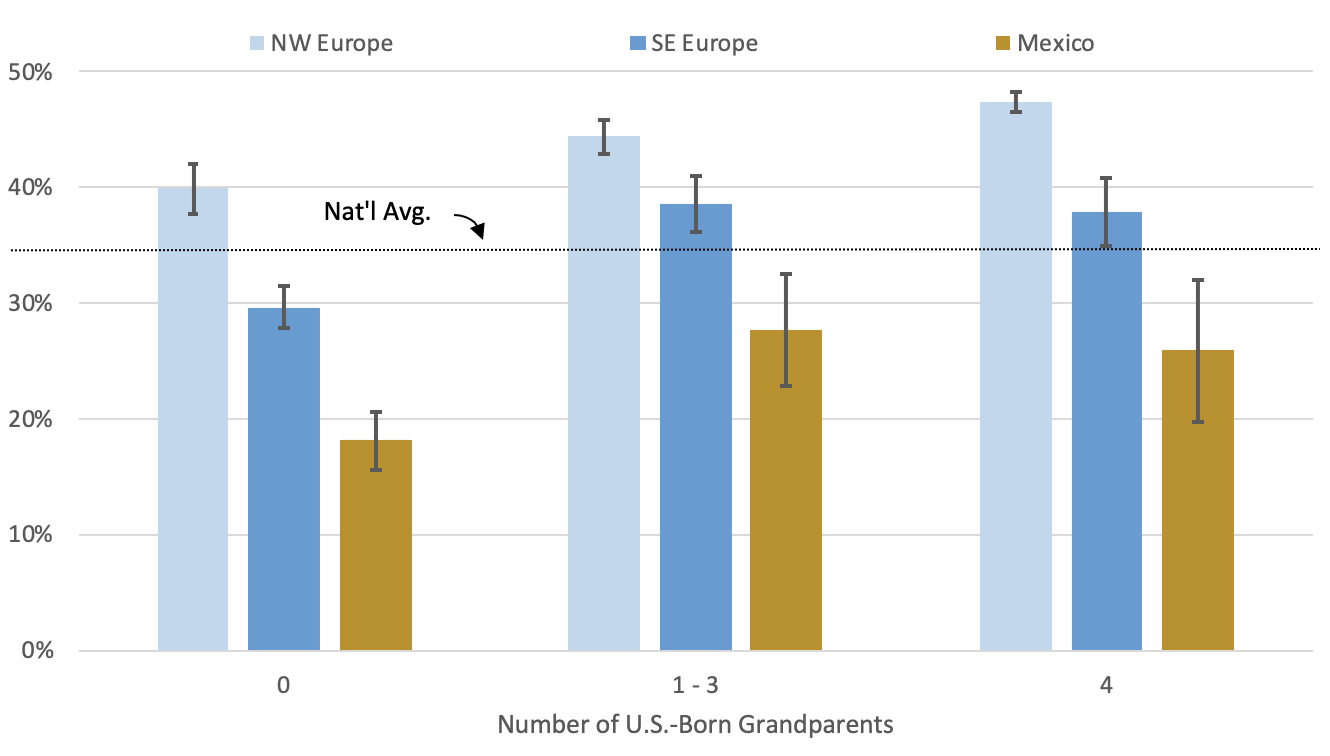
How long will that boost last? One interpretation of Figures 1 and 2 is that political assimilation does occur — albeit slowly — such that the grandchildren or great-grandchildren of today’s immigrants will vote as the NW European ancestry group does today. Unfortunately, although tenure clearly impacts party preference, ancestry itself seems to exert an independent effect. Figure 3 takes individuals from the three ancestry groups for which sufficient data exist and breaks out their Republican identification by the number of U.S.-born grandparents they have.
Figure 3. Share Republican by Ethnicity and Grandparent Birthplace |
 |
|
Source: General Social Survey, 1972-2022 The horizontal dotted line indicates the national average of 35%. Figures are adjusted to control for age and year of interview. The error bars represent a 95% confidence interval. |
Among individuals with four U.S.-born grandparents, 47 percent of NW Europeans identify as Republicans, compared to 38 percent of SE Europeans and 26 percent of Mexicans. These results imply that the political allegiances that immigrants develop have remarkable staying power. Tenure only modestly attenuates the differences across ancestry groups.
Obviously, conservatives are going to be more concerned about immigration inducing a leftward shift than progressives are. However, any exogenous political change, to the left or the right, can cause social disruption and undermine democratic legitimacy. Limiting immigration would limit the disruption.
Methodological Notes
At least 100 cases in the GSS were required for each ancestry group displayed in Figures 1 and 2. Vaguely-named groups like “Other European” were excluded. Puerto Rico was excluded because it is a U.S. territory. The vertical axis on Figure 1 includes any respondents who are “slightly conservative” through “extremely conservative”. The vertical axis on Figure 2 includes any respondents who are “independent, close to Republican” through “strong Republican”. Respondents with missing ideology or party information are excluded from the denominators of the average conservative or average Republican calculations, respectively.
Figure 3 is derived from an individual-level logistic regression of Republican party identification (defined as in Figure 2) on the following independent variables: age group in 10-year intervals, decade of interview, the main effect of tenure, the main effect of ancestry group, and the interaction of tenure and ancestry group. Predictive margins are calculated at the means of age and decade of interview. Individuals with between one and three U.S.-born grandparents are combined to boost sample size.
GSS ancestry groups in NW European category: Austria, French Canada, Other Canada, Denmark, England & Wales, France, Germany, Ireland, Netherlands, Norway, Scotland, Sweden, Switzerland, Belgium, Australia, New Zealand.
SE European category: Czechoslovakia, Finland, Greece, Hungary, Italy, Poland, Russia, Spain, Poland, Lithuania, Yugoslavia, Romania.
Ancestry is determined by answers to this question: “From what countries or part of the world did your ancestors come?” If more than one response is offered, respondents are asked to pick the ancestry they feel closest to.