Download this Backgrounder as a pdf
County and MSA Data
Analysis of birth records shows that in 2002 almost one in four births in the United States was to an immigrant mother, legal and illegal, the highest level in American history. The enormous number and proportion of children from immigrant families may overwhelm the assimilation process, making it difficult to integrate these new second-generation Americans. At present, the U.S. government automatically gives American citizenship to all people born in the country, even the children of tourists and illegal aliens.1
Among the study's findings:
- In 2002, 23 percent of all births in the United States were to immigrant mothers (legal or illegal), compared to 15 percent in 1990, 9 percent in 1980, and 6 percent in 1970.
- Even at the peak of the last great wave of immigration in 1910, births to immigrant mothers accounted for a slightly smaller share than today. After 1910 immigration was reduced, but current immigration continues at record levels, thus births to immigrants will continue to increase.
- Our best estimate is that 383,000 or 42 percent of births to immigrants are to illegal alien mothers. Births to illegals now account for nearly one out of every 10 births in the United States.
- The large number of births to illegals shows that the longer illegal immigration is allowed to persist, the harder the problem is to solve. Because as U.S. citizens these children can stay permanently, their citizenship can prevent a parent's deportation, and once adults they can sponsor their parents for permanent residence.
- The large number of children born to illegals also shows that a "temporary" worker program is unrealistic because it would result in hundreds of thousands of permanent additions to the U.S. population each year, exactly what such a program is supposed to avoid.
- Overall, immigrant mothers are much less educated than native mothers. In 2002, 39 percent of immigrant mothers lacked a high school education, compared to 17 percent of native mothers. And immigrants now account for 41 percent of births to mothers without a high school degree.
- The dramatic growth in births to immigrants has been accompanied by a decline in diversity. In 1970, the top country for immigrant births -- Mexico -- accounted for 24 percent of births to immigrants, by 2002 it was 45 percent.
- As a share of all births in the country, Mexican immigrants accounted for one in 10 births in 2002. No single foreign country has ever accounted for such a large share of births.
- In 2002, births to Hispanic immigrants accounted for 59 percent of all births to immigrant mothers. No single cultural/linguistic group has ever accounted for such a large share of births to immigrants.
- The states with the most dramatic increase in births to immigrants in the last decade are Georgia, North Carolina, Nevada, Nebraska, Arkansas, Arizona, Tennessee, Minnesota, Colorado, Delaware, Virginia, and Maryland.
- Immigrants account for such a large percentage of births because they have somewhat higher fertility and are more likely to be in their reproductive years than natives. However, the difference with natives is not large enough to significantly affect the nation's overall age structure.
- Immigrants who have arrived in the last two decades plus all of their U.S.-born children have only reduced the average age in the United States from 37 to 36 years.
- Looking at the working age share (15 to 64) of the population also shows little effect from immigration. With or without post-1980 immigrants and their U.S.-born children, 66 percent of the population is of working age.
- While immigration has little effect on the nation's age structure, new immigrants (legal and illegal) plus births to immigrants add some 2.3 million people to the nation's population each year, making for a much larger overall population.
Introduction
It is difficult to imagine a government program that has a more profound impact on society than immigration. Large numbers of immigrants and their descendants cannot help but shape the destiny of the country in which they settle. (The terms "immigrant" and "foreign born" are used synonymously in this report.) Even after the original immigrant dies or returns home, his children and descendants will continue to exert a powerful influence on their new country's demographic, political, economic, and cultural life. Examining births to immigrants is therefore important, because it is a way of measuring the scale of immigration and its impact on American society. This is especially true because the U.S. government has chosen to award American citizenship to all persons born in the United States, including those born to temporary visitors or even illegal aliens. As citizens, it seems almost certain that the vast majority of these children will live in America.
Why Study Immigrant Births?
Public Expenditures on Children. All levels of government provide services to children. Therefore, it is necessary to understand the effect of immigration policy on the number of children being born in the United States in order to better anticipate spending on services, especially public schools. Children from immigrant families may also have needs that are different from those of children from native families. Given the large share of births to immigrants, how these children integrate into American society is critically important to the future of the country. Thus a better understanding of immigration's impact on births is necessary so that government may better meet the needs of these children.
Assimilating the Children of Immigrants. There are now more than 30 million immigrants living in the country. It is sometimes suggested that because immigrants are now so numerous it lowers their interaction with natives and reduces their need to integrate fully into American society. Advocates of high immigration often respond that immigrants account for a smaller share of the population today than during the peak of the last great wave of immigration, yet those immigrants integrated successfully. These advocates seem to be saying that the relative sizes of the immigrant and native population matter, but we have not reached the level of the last great wave, so there is little reason to worry.
Of course, given the enormous changes in the world, it is not clear that comparing current immigration with that of a century ago makes sense. Nor is it clear that the very peak level of immigration, which itself was unusual in American history, is the best point of comparison. Nonetheless, it is true that at the very peak of the last great wave in 1910, the foreign born were a larger share of the total population -- about 15 percent versus 12 percent today. However, examining births to immigrants is relevant to the assimilation debate because it is another way of measuring the scale of immigration and its impact on American society.
Although children born to immigrants are by definition natives, the number and share they represent of all births may have some bearing on how they assimilate. After all, if births to immigrants comprise a very large share of all births, then children from immigrant families may tend to interact primarily with each other, having little contact with the children of natives. As a result, foreign cultural norms, values, and even identities may be dominant among these children. Of course, the fact that a very large share of children may come from immigrant families does not necessarily prove that assimilation will be less complete, since assimilation is a multifaceted and complex process. But the issue of births to immigrants certainly is germane to the debate over the likely course of assimilation.
Research on the Second Generation. The changing share of immigrant births is important because it may help us to better understand how things are changing for the children of immigrants. Researchers often examine the assimilation of adults who had immigrant parents, referred to as second-generation Americans. But the environment in which such individuals grew up may have fundamentally changed. For example, an American born three decades age to immigrant parents was raised in a country where only about one out of 20 U.S.-born children had a foreign-born mother compared to one in four today. The situation for the children of Mexican immigrants is even more striking. In 1970, 54,000 children were born to Mexican immigrant mothers and they accounted for 1.5 percent of all births. In 2002, 408,000 children were born to Mexican immigrant mothers, accounting for 10.1 percent of all births. This change likely will have significant impact on the childhood experience for these children. A person born to immigrants 30 years ago may have grown up with relatively very little contact with other children whose mothers came from the same country. But given the enormous growth in numbers, a child born to an immigrant today may have a very different sense of identity. We at least need to be aware of how things have changed when thinking about the experiences of second-generation Americans.
Characteristics of Those Having Children. Another reason to examine births to immigrants is that it provides some insight into the environment that the children of immigrants are being born into. For example, data are available on the education level of each child's mother. Education is important because it is the single best indicator of income and overall socio-economic status. Parental education levels are also a good predictor of how much education the child will ultimately obtain. Thus, examining characteristics such as education provides important clues to the life prospects of these children, and how they may differ from those born to native mothers.
Births to Illegal Aliens. Illegal immigration is one of the most contentious issues of our time. The debate involves many complex topics that go well beyond the scope of this analysis. Birth data, however, can better inform the debate over illegal immigration by providing insight into the number of children born to illegal alien mothers each year. (How one estimates births to illegals will be discussed at length in the next section.) The number of these children has direct bearing on what policy options we decide to pursue in dealing with this problem.
A large number of children born to illegals may mean, for example, that a temporary worker program, like the one outlined by President Bush, is unrealistic. As U.S. citizens, all children born to guestworkers would have the right to stay permanently. Presumably most would return home if their parents did so, but some would be placed with relatives or even family friends in the reasonable belief that they would have better lives in America. As citizens this would be their right. But even assuming the parents return home and take their U.S.-born children with them, these citizen children have the right to return to America at any time. A significant share can be expected to do so when they reach adulthood.
Additionally, under current law, the citizenship of these children can be used to prevent their parent's deportation. This is because immigration judges can and do take into account the harm done to American citizens by a deportation. Thus, if many guestworkers or illegal aliens with U.S. citizen children decide to stay in America and fight deportation, their U.S. citizen children give them excellent grounds to do so. It must also be remembered that once these children are adults they have the right as citizens to sponsor their parents for permanent residence without any numerical caps. All of these factors mean that a "temporary" worker program would result in tens of millions of permanent additions to the U.S. population, which is precisely what a temporary worker program is supposed to avoid. But without a careful analysis of birth data of the kind done here, one may not realize this.
Data and Methodology
Data. The data for this study come from birth certificates registered in all 50 states and the District of Columbia. The National Center for Health Statistics (NCHS), which compiles the data, reports that more than 99 percent of births occurring in this country are registered.2 This means that births to illegal aliens are also included in this data. The 1990 and 2002 public use files used for this study include all births in the United States (over four million cases in 1990 and 2002) and are not samples. The 1980 public use file includes 100 percent data for all but seven states, which provided NCHS with 50 percent samples.3 The 1970 data file is a 50 percent sample (1.9 million cases) from every state. All figures in this report are for births occurring within the 50 states and the District of Columbia. Information about the mother's current place of residence, race, age, and education level, as well as other information, are available in the public use file for mothers.
In most, but not all, of its published reports the NCHS does not include births to mothers who indicated that they reside outside of the United States. In 2002, for example, there were 4,027,376 births in United States and all of these records are on the public use file used for this study. NCHS published reports generally show only 4,021,726 births for 2002. The 5,650 difference is births to women who report that they reside outside of the United States. While only a tiny fraction of all births, it seems incorrect to exclude these births, since all of these children are U.S. citizens.4 In fact, in some cases the data show that the mother herself was born in the United States. Therefore, this report includes all births in the United States, including those to mothers who reside outside of the country. This means that state or county figures reported in this study on the place of residence of the mother will match published numbers form NCHS, but the national total for births in the United States are very slightly higher than in NCHS published figures because we include births to mothers who gave a foreign residence.
Immigrant Mothers. All mothers are asked about their place of birth. This study focuses on the years 1970, 1980, 1990, and 2002. In each of those years, 99.8 percent of mothers indicated a place of birth. The 0.2 percent of the population that do not report place of birth of mothers will be counted with natives. Of foreign-born mothers in the public use file, only those born in Mexico, Canada, and Cuba are reported separately. Mothers born in other countries are simply designated as "remainder of the world." We define foreign-born mothers as those born outside of the United States. Mothers born within the United States or in one of its outlying territories, such as Puerto Rico, are considered natives. In published reports, the NCHS counts individuals born in outlying territories as being foreign born. However, in my view it makes more sense to count these mothers as natives because they are all U.S. citizens, and were citizens from the day they were born. It should be noted that births to mothers from outlying U.S. territories comprise less than 1 percent of all births in the United States. Counting those born in outlying territories as natives is consistent with the Census Bureau definition of native/foreign born.5 As already indicated, throughout this report we use the term immigrant and foreign-born synonymously when referring to mothers.
What About Immigrant Fathers? The natality data used in this study do not include a question about the father's country of birth. However the Current Population Survey (CPS) collected by the Census Bureau does ask this question, though the sample size is relatively small and, unlike the natality data, there is some undercount in the CPS. The March 2002 CPS shows that for children born in the United States in the year prior to the survey, 84 percent who had a foreign-born mother also had a foreign-born father. Among Hispanic immigrants it was 88 percent. If adjusted for undercount, it seems likely that 86 percent of children born to immigrant mothers also have immigrant fathers. A similar percentage of children with an immigrant father have an immigrant mother in the CPS.
Estimating Births to Illegal Aliens. As already indicated, more than 99 percent of births in the United States are recorded. Thus the birth data include births to those in the country illegally. To arrive at an estimate of births to illegals, we estimate births per thousand for various demographic categories of immigrant women in their reproductive years. To do this we first generate a mid-2002 estimate of the total foreign-born population so that the number of births relative to the size of the population can be calculated.6 We then combine this estimate with the number of births from the NCHS data to get immigrant fertility rates by age, education level (for Mexicans), and region or country of origin. Dividing the number of births by the size of female foreign-born population in demographic category produces birth rates. Once we estimate birth rates by category, we then estimate the number of illegal alien women in each category.7 To estimate the size of the female illegal alien population of reproductive age by category we rely on prior research and our own analysis.8 We assume that illegal aliens have the same fertility as their legal counterparts. The available evidence indicates that the fertility of illegal aliens does not differ significantly from their legal counterparts with the same characteristics.9
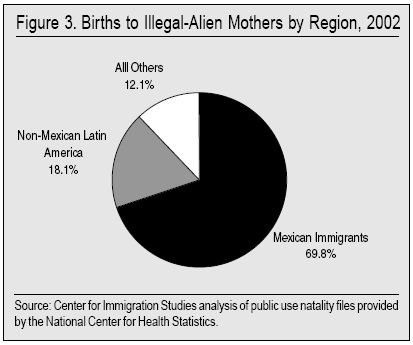
Our best estimates indicate that there were 383,000 births to illegal alien mothers in 2002, accounting for 42 percent of all births to immigrants and 9.5 percent of all births in the country. While this may seem like a surprisingly large share of births, it must be remembered that our own research, as well as work by the Urban Institute, Pew Hispanic Center, and the Census Bureau, indicates that more than one-fourth of the nation's immigrant population is illegal. Moreover, because illegals come mainly to work, they are overwhelmingly in their primary reproductive years, comprising more than one-third of all immigrants age 18 to 39. Illegals tend to either gain legal status as they grow older or eventually return to their home countries. Therefore, the illegal population tends to be comprised of individuals in their 20s and 30s. In contrast, there are a larger number of older legal immigrants who have lived in the country for a long time and are over age 40. In addition, all prior research indicates that 80 percent or more of illegal immigrants are Hispanic, a group with relatively high fertility. For these reasons, illegal immigrants account for a much larger share of births than their share in the overall population or the immigrant population.
Birth to Immigrants Nationally
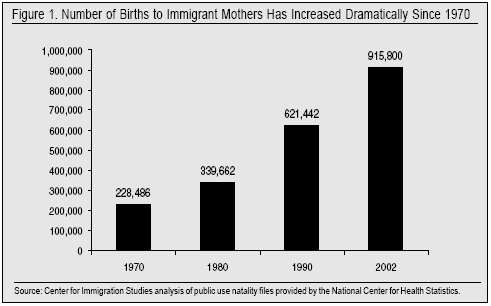
Number of Births to Immigrants. Figure 1 reports the number of births to foreign born mothers between 1970 and 2002. The figure shows dramatic growth in births to this population. The number of births to immigrants has grown from about 230,000 in 1970 to more than 900,000 in 2002, a 300-percent increase. The dramatic growth in births to immigrant mothers is even more rapid than the very substantial growth in the overall immigrant population. Between 1970 and 2002, the number of immigrants in the United States increased from 9.6 million to 32.5 million -- a 237 percent increase.10 While the overall growth in the immigrant population has been substantial, the growth in the number of immigrants was still less than the increase in births to immigrants.
Share of Births to Immigrants. Figure 2 shows that as a share of all births in the United States, births to immigrants has increased dramatically in recent years. In 1970, 6.1 percent of births were to immigrant mothers; by 2002 it was 22.7 percent. The share of all births accounted for by immigrant mothers has increased 272 percent since 1970. To understand just how large the immigrant share has become, consider that the 22.7 percent of all births attributable to immigrants is more than 50 percent larger than the 14.7 percent of births that black mothers represent. Or put a different way, in 2002 there were more births to immigrants than all the births in 28 states plus the District of Columbia combined.
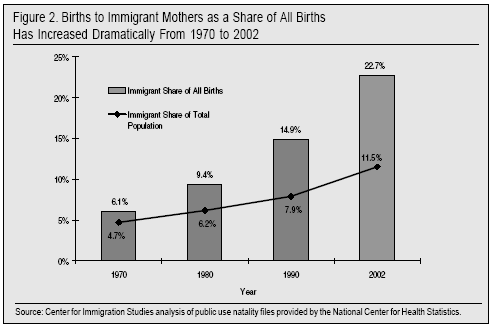
Figure 2 also shows that over the last two decades the immigrant share of all births has increased much more rapidly than their share of the total population. As mentioned above immigrants increased their share of births by 272 percent, but as a share of the total population they increased 145 percent. As a result, the difference between their share of the total population and their share of births has increased significantly. In 1970 immigrants accounted for 4.7 percent of the total population and 6.1 percent of births -- a 1.4-percentage point difference. But by 2002 they were 11.5 percent of total population and 22.7 percent of all births -- an 11.2 percentage point difference.
What Explains the Rapid Rise in Immigrant Births? There are several factors contributing to the rise in the number of births to immigrants, and their share of all births. First and most obvious is simply the increase in the number of immigrants and their share of the overall population. But as we have seen, Figure 2 also shows that relative to their share of the total population, births to immigrants increased as well. The reason for this change is due to both the changing fertility rates and age structures of the immigrant and native populations. We examine those changes below by comparing Census Bureau population counts with birth records.11
In 1970, the current wave of immigration had only just begun and a large share of immigrants were long-time residents and, as a result, many were no longer in their primary reproductive years. The 1970 Census shows that only 36 percent of female immigrants were 15 to 44 years of age, much less than the 41 percent of natives. But the 1980 Census shows that 46 percent of female immigrants were 15 to 44 years of age, almost the same as the 45 percent of native born Americans in this age group. Fertility declined for both groups between 1970 and 1980, from roughly 119 births per thousand among immigrant women age 15 to 44 to 98 births per thousand, and from 87 births per thousand for native women in 1970 to 66 births. But fertility differences between the two groups remained constant at 32 births per thousand. Thus the primary reason immigrants increased their share of births relative to their share of the total population between 1970 and 1980 was an increase in the share of immigrants in their primary reproductive years. By 1990 things had changed significantly: While 45 percent of natives were still in their primary reproductive years, 53 percent of immigrants were in this age group. Moreover, immigrant fertility went up to 117 births per thousand for women 15 to 44, but remained relatively constant for natives at 67 per thousand. Thus the increase in the share of all births that immigrants accounted for between 1980 and 1990 was due to both an increase in immigrant fertility and an increase in the share of immigrants who were in their child-bearing years. However, for the time period 1990 to 2002 the situation is somewhat different.
Between 1990 and 2002 fertility for immigrants aged 15 to 44 actually fell from 117 births per thousand to 102 births. Fertility for natives also fell from 67 to 59 births per thousand. Thus the gap between immigrant and native fertility actually narrowed somewhat after 1990. However, the share of immigrants in their primary reproductive years continued to increase, from 53 percent in 1990 to 56 percent in 2002, while it fell for natives from 45 percent to 41 percent. Therefore, the increase in the immigrant share of births relative to their share of the total population between 1990 and 2002 was the result of a rise in the percentage who were in their primary reproductive years and not a widening gap between immigrant and native fertility. Overall, immigrants increased their share of births from 1970 to 2002 for three reasons: First, and most obvious is the dramatic increase in the overall size and share of the population that immigrants represent; second, the share of immigrants who are in their primary reproductive years increased relative to natives; third, the gap between immigrant and native fertility widened. Though this gap narrowed after 1990, it is still wider than it was in 1970.
Historical Comparison. Figures 1 and 2 make clear that the number of births to immigrants and their share of all births represent a fundamental change from the recent past. But what of the last great wave of immigration? Many observers feel that the current situation is analogous to the early 20th Century, when immigrants represented a very large share of the total population. In 1910, immigrants reached 14.7 percent of the total population, after which time the number entering was significantly reduced by WWI and restrictive legislation in 1921 and 1924. Unfortunately, detailed administrative data on births going back to that time period does not exist. But the 1910 Census can be used to estimate the share of births that were to immigrants. Using the public use file of the 1910 Census, we estimate that 21.9 percent of all births were to immigrant mothers, somewhat less than today.12 This estimate indicates that births to immigrants in 2002 likely accounted for a larger share than at any time in American history. In interpreting these numbers it is also important to realize that immigration was significantly reduced after 1910. But no such reduction seems to be in the offing today. Absent a change in immigration policy it is very likely births to immigrants will reach 30 percent of the total within a decade or so. Thus in a very real sense the present situation and the immediate future are without precedent in American history. As a nation we are headed into uncharted territory.
Characteristics of Mothers
The increase in births to immigrants described above provides only an overview of the numbers and percentages. In this section, we will examine the characteristics of immigrant mothers in order to better understand this social phenomenon.
Educational Attainment of Mothers. The top portion of Table 1 shows the educational level of immigrant and native mothers. Unfortunately, a large number of states, including many of the biggest states, did not collect information on the education levels of new mothers in 1970. By 1980 most did ask the question, however several large immigrant-receiving states still did not. Therefore is not possible to examine education levels of new mothers for 1970 or 1980 at the national level. (Later in this report, we will look at the education level of immigrant mothers for those states that collected this information in 1980.) Data for 1990 and 2002, however, show a very large gap in the education levels of immigrant and native mothers. In 1990, 44 percent of immigrant mothers lacked a high school education and 38.9 percent lacked one in 2002. In sharp contrast, only 20.2 percent of native mothers had not completed high school in 1990 versus 16.5 percent in 2002. While the share of each group that lacked a high school degree did decrease over this time period, the gap between the two groups narrowed very little and remained enormous -- 22.4 percentage points in 2002. Despite a modest decline in the share of immigrant mothers who lack a high school degree, the absolute number of births to immigrants without a high school degree increased by 83,000 between 1990 and 2002. This is possible because the number of births to immigrants increased so much that even though the percentage with little education decreased, the overall number actually increased. Between 1990 and 2002, the number of births to natives without high school degrees declined by 202,000. As a result, births to immigrants represent a growing percentage of births to less-educated mothers. The 356,000 births to immigrant mothers without a high school degree accounted for 40.6 percent of all births to those without a high school degree in 2002, compared to 27.9 percent in 1990. The immigrant share of births to dropouts is striking -- especially compared to the 11.5 percent of the total population immigrants represent.
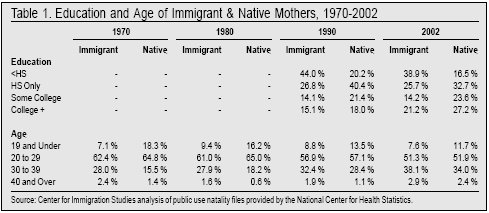
Among more educated mothers, the gap seems to have actually grown somewhat wider between immigrants and natives. In 1990, 15.1 percent and 18 percent of births to immigrant and native mothers, respectively, were to those with at least a four-year college degree, a 2.9-percentage point difference. In 2002 that difference had widened to six percentage points, with 21.2 percent of immigrant mothers and 27.2 percent of native mothers having a bachelors degree. Thus, although there was an increase in the share of both immigrant and native mothers with a college degree, the percentage went up more for natives and as a result the difference between the two groups grew larger between 1990 and 2002. In general, the data do not show much convergence between the two groups at the top or bottom end of the education distribution. The education level of immigrant mothers has remained quite different from that of natives, and those differences have persisted for at least a decade.
Importance of Education. The very large share of births to immigrants with little formal education has important implications for those children for two reasons: First, education is the single best predictor of income for overall socio-economic standing. Given the education level of many immigrant mothers, it is certain that many of the children of immigrants are growing up quite poor, and this may have a long-term impact on these children. For example, 37 percent of young children in households headed by an immigrant with less than a high school education live in poverty and an additional 41 percent have low incomes (albeit above poverty).13 What's more, it is well established that parental education, while not the only factor, is an important determinant of children's likely educational attainment.14 With dropout rates for native-born Hispanics running about twice that of other natives, the large number of births to immigrants with little education may mean that this troubling trend will persist.15 This has significant consequences for the prospects of these new second-generation Americans because education has become so important to economic success in the modern American economy. Of course, it is very difficult to predict how much education these children may ultimately receive. However, given the education levels of immigrant mothers, it is clear that a very large percentage of children in immigrant families are growing up in circumstances that are quite different from their native-born counterparts.
Age of Mothers. The bottom of Table 1 reports the percentage of children born to immigrant and native mothers in their teens, twenties, thirties, and forties. In terms of the share of mothers in different age categories, there does not seem to be much meaningful difference between immigrant and native mothers. A slightly larger share of native mothers are teenagers than is the case among immigrant mothers. Of course, most immigrants come to America after age 19, thus there are relatively few teenage immigrants. Therefore it is not surprising that there are relatively few births to teenage immigrants. Nonetheless, the fact that only about 8 percent of births to immigrants are to teenagers is good news, and the overall decline in teenage births for both groups is clearly a positive social trend.
Race and Ethnicity of Mothers. The top portion of Table 2 reports the race and ethnicity of new mothers. The 1970 data do not include information on whether the mother is Hispanic so the data is not directly comparable to other years. Not surprisingly, the figures show that immigrant and native mothers tend to be from different groups. This difference has become somewhat more pronounced over time. In 1980 almost 94 percent of native mothers were either non-Hispanic black or white, compared to 37 percent of immigrant mothers. By 2002, only 22 percent of immigrant mothers were non-Hispanic black or white, compared to 87 percent of native mothers. While the percentages have declined somewhat, native mothers remain overwhelming black or white, but those two groups make up only 22 percent of new immigrant mothers in 2002. In contrast, immigrant mothers tend to be overwhelmingly Asian or Hispanic. In 1980 almost 63 percent of immigrant mothers were from those two groups, compared to less than 6 percent of native mothers. By 2002, the Asian and Hispanic share of new mothers had risen to almost 78 percent among immigrants, but still only represented 12 percent of native mothers. The main change among immigrants over this time has been a decline in the share of births to non-Hispanic whites and a rise in the share of mothers who are Hispanic.
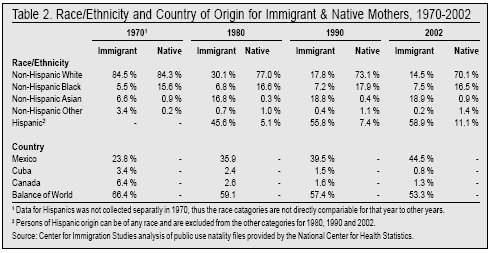
As already indicated, the public use file of birth records does not contain detailed information on the mother's country of birth. However, three countries are reported separately: Mexico, Cuba, and Canada. The bottom of Table 2 shows the share of immigrant mothers who are from those three countries. Mexico is by far the top country for immigrant mothers. This is not surprising, because Mexico is by far the top immigrant-sending country, both for legal and illegal immigration. Putting aside figures for births, in 2002 nearly 30 percent of the total foreign-born population was from Mexico. Moreover, Mexican immigrants tend to be relatively young and in their primary reproductive years, and they tend to have the highest fertility of any major immigrant group. For these reasons, births to Mexican immigrants account for almost 45 percent of all births to immigrants in 2002, significantly higher than the 30 percent they represent of the total immigrant population. The Mexican share of births to immigrants has increased substantially: from 23.8 percent in 1970 to 35.9 percent in 1980, and 39.5 percent in 1990 to 44.5 percent in 2002. Throughout the time period examined in Table 2, although data for other Hispanics are limited in 1970, Mexicans have accounted for at least three-fourths of births to Hispanic immigrants.16 Given that more than 10 million Mexican-born people now live in the United States, both legally and illegally, Mexico will continue to account for a very large share of births to immigrants for decades to come.
Declining Diversity Among Immigrant Mothers. In one sense, today's immigration is more diverse than ever because people now arrive from every corner of the world. In another sense, however, the diversity of immigrants has declined significantly in the last two decades. As Table 2 shows, one country -- Mexico -- and one region -- Spanish-speaking Latin America -- have come to dominate U.S. immigration during the last two decades. Putting aside births, the decennial census as well as other Census Bureau data show that Mexico, the top sending country in 1980, increased its share of the total immigrant population from 16 percent in 1980, to 22 percent in 1990 and to 30 percent in 2002. The same data also show that Hispanic immigrants as a group increased their share of the total immigrant population from 30 percent in 1980 to nearly half of all immigrants by 2002. The birth data in Table 2 show an even more pronounced decline in diversity than in the overall immigrant population. Mexican mothers increased their share of births to immigrants from 35.9 percent to 44.5 percent between 1980 and 2002. Hispanic immigrants increased their share from 45.6 percent to 58.9 percent.
The enormous growth in the number of births to immigrants from Mexico and the rest of Latin America means that the children of these immigrants will grow up in very different circumstances than children born to these groups a generation ago. For example, a child born to a Mexican immigrant mother in 1970 was entering a country where 1.5 percent of all children (including births to natives) had a Mexican immigrant mother. But that same child born in 2002 is growing up in a country where more than 400,000, or 10.1 percent, of all U.S.-born children his age have a Mexican immigrant mother. A similar situation exists with Hispanic immigrants. In 1980, 150,000, or 4.1 percent, of all children were born to Hispanic immigrants, but by 2002, 540,000 children were born to Hispanic immigrants, and they comprised 13.4 percent of all U.S.-born children. The opportunity to have continual contact with children from the same background is now dramatically greater than it was 20 or 30 years ago.
It seems reasonable to assume that the declining diversity of immigrants must have some implications for American society. The most serious potential problem associated with declining diversity is that it may hinder the assimilation and integration of immigrants and their children. Much larger numbers may provide the critical mass necessary to create linguistic and spatial isolation. In contrast, a more diverse immigrant population may increase incentives to learn English or become familiar with American culture more generally. The English language and American culture are the means by which diverse groups communicate with each other and the larger society. But if one group dominates in an area, then this could fundamentally reduce the need to Americanize. No one country has ever accounted for such a large share of births to immigrants as do Mexican immigrants today. Our analysis shows that at the peak of immigration in 1910, the top country of immigrant births was the Russian Empire, which accounted for 18 percent of births to immigrants. Immigrants from Russia were extremely heterogeneous and included some ethnic Russians as well as Poles, Ukrainians, Jews, and immigrants from the Baltic states. Immigrants from Italy, a more homogenous group, accounted for slightly more than 16 percent of births to immigrant mothers. Moreover, immigrants from Russia and Italian immigrants each accounted for less than 4 percent of all births in America in 1910. In contrast, Mexican immigrants accounted for 10 percent of all births in 2002. The declining diversity of immigrants along with the rapid growth in the number of immigrants means that America is entering a new time, heretofore unknown in its history, when one group is dominant among immigrants decade after decade. This fact is reflected in the birth data. It is not at all clear what the outcome of this situation will be.
Education Level by Race and Ethnicity. Table 3 shows the education level of immigrant and native mothers by race and ethnicity. The table shows very large differences between groups in both 1990 and 2002. As already discussed, national data on the education level of mothers does not exist for 1980 because several large states did not collect that information then. In general, Hispanic immigrant mothers tend to have the lowest education levels, while those from Asia tend to have the highest. In 1990 there was a 43.1-percentage-point difference between the share of Asian versus Hispanic immigrant mothers who lacked a high school education. By 2002, the difference was 48.8 percentage points. Although the share of each group that lacked a high school degree improved, Asian immigrant mothers improved more, and as a result the gap with Hispanics actually grew. A similar situation exists when comparing Hispanic immigrants to all natives.
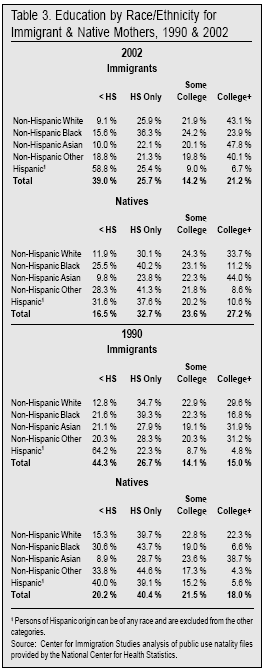
In 1990, 20.2 percent of all native mothers lacked a high school education compared to 64.2 percent of Hispanic immigrant mothers -- a 44 percentage-point difference. In 2002, 16.5 percent of native mothers and 58.8 percent of Hispanic immigrant mothers lacked a high school education -- a 42.3-percentage point difference. While the gap narrowed a little, the difference remained huge. In fact, the actual number of children born to less-educated Hispanics actually increased because the overall Hispanic immigrant population grew so much. In 1990, 223,000 children were born to Hispanic immigrant mothers without a high school degree. In 2002 it was 317,000.
At the top end, the difference between all natives and Hispanic immigrant mothers actually widened. In 1990, 18 percent of natives and 4.8 of Hispanic immigrant mothers had at least a four-year college degree -- a 13.2 percentage-point difference. By 2002, 27.2 percent of native and 6.7 of Hispanic immigrant mothers had a college degree -- a 20.5 percentage-point difference. Although the share of both groups with a college degree increased, native mothers made much more substantial gains and the gap widened significantly. This is not the case for Asian immigrant mothers, a much larger share of whom had a college degree in 2002 than in 1990. As a result, the gap with natives in terms of college graduates actually become more pronounced in favor of Asian immigrants between 1990 and 2002.
Table 3 shows that some of the largest gains in terms of education among immigrant mothers were among black immigrants. Over this time period, the share lacking a high school degree declined significantly, and the share with a college degree increased a good deal. Although we cannot say for sure from this data, the increasing education of black immigrant mothers may reflect the increasing share of black immigrants who are skilled professionals from Africa. In contrast, earlier waves of black immigration were almost entirely Caribbean. Table 3 makes clear that there is great diversity in the educational level of immigrant mothers. Immigrant mothers from some parts of the world are more educated than natives while other groups are much less educated than natives. But overall, immigrant mothers in 2002 were much less educated than natives, and the difference between the two groups has narrowed little or not at all in the last decade.
Births to Illegal Aliens. As indicated in the methodology section, we estimate that there were 383,000 births to illegal alien mothers in 2002, accounting for 41.9 percent of births to immigrants. Figure 3 shows the region or country of birth for illegal alien mothers in 2002. The vast majority of illegal mothers were from Mexico or elsewhere in Latin America. One question the data do not answer is what share of the fathers were legal residents. We can say that the number of illegal alien women married to American citizens (native born or naturalized) is trivial because American citizens can sponsor their spouses for green cards without numerical limits. But not all illegal alien mothers are married. In addition, some of the fathers of these children might be Lawful Permanent Residents (LPRs). In some cases, the spouses of LPRs must wait to receive a green card because of numerical limits. Of course, this situation would only arise if someone married an illegal alien after he had received LPR status but before he became a citizen, which he can do after being in the country for five years. Otherwise, when the immigrant received LPR status he would have been able to bring his spouse with him as part of the normal legal immigration system. It seems likely that perhaps 5 to 10 percent of children born to illegal mothers have a legal father, but it is not easy to say for sure. Of course, a similar situation must exist among illegal alien fathers who have a child with a woman who is in the country legally. Birth data, however, do not indicate if the father is foreign born.
Significance of Births to Illegals. The large number of children now being born to illegal aliens each year is important for a number of reasons. First, it makes clear the enormous scale of illegal immigration. Consider that in recent years between 400,000 and 600,000 legal immigrants chose each year to become American citizens; in 2004 it was 536,174. In comparison, births to illegal immigrants are adding nearly 400,000 citizens. It is not inconceivable that if illegal immigration is allowed to continue, there may come a time in the not too distant future when births to illegal immigrants will actually add more citizens to the United States each year than naturalizations of legal immigrants.
Second, because all of these children are American citizens, there is a permanence to the illegal alien problem. As U.S. citizens, these children have a right to stay permanently, their citizenship can prevent a parent's deportation, and once adults they can sponsor their parents for green cards. Thus even if all illegals were to go home, the consequences of tolerating illegal immigration are very long-term. Third, births to illegals remind us that illegal aliens are not simply workers or mere factors of production, which is how so many in the business community tend to see them. They are human beings, who have children and thus impact our society in a host of ways. We estimate that two-thirds of illegal alien mothers lack a high school degree. Clearly many of the children of illegal aliens will grow up in circumstances very different from those of children of natives, even if their parents are given legal status. Thinking about illegal immigration simply as a source of cheap labor misses the enormous long-term challenges it creates for the country as we attempt to improve the lives of millions of children born to illegal alien parents who have little education. An additional effect of illegal immigration is the cost to taxpayers. As American citizens, the children of illegal aliens are eligible for all social services provided by federal, state, and local government. But even putting the long term costs aside, the fiscal impact of just paying for the births to illegal aliens is huge. We estimated that the cost to taxpayers of paying for just the births to uninsured illegal alien mothers was $1.7 billion in 2002.17
State and Local Data
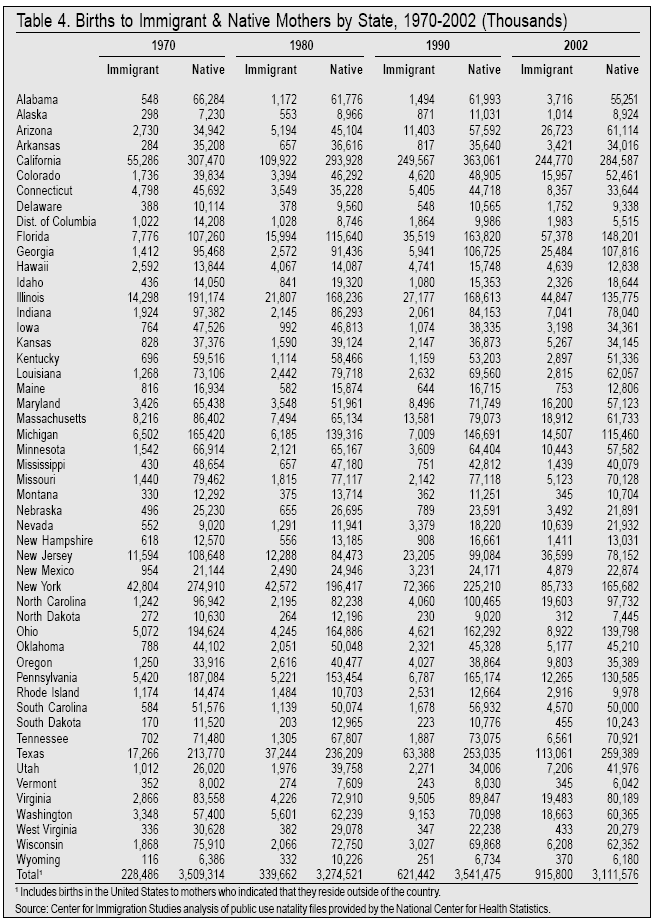
Number of Births to Immigrants by State. Table 4 shows the number of immigrant and native births by state for 1970, 1980, 1990, and 2002. With almost no exceptions, births to immigrants increased in every state in the last three decades. In many states the growth can only be described as phenomenal. Nevada, Georgia, and North Carolina saw the most dramatic increases between 1970 and 2002. In Nevada the number increased 19 times, in Georgia the number increased 18 times and in North Carolina the increase was nearly 16 times.
Putting aside Nevada, which was a very small state in 1970, since 1980 the number of births to immigrants has increased 11 times in Georgia almost 10 times in North Carolina. In total, 21 states saw at least a five-fold increase in births to immigrant mothers since 1970. In 22 other states the number more than doubled. Even just the period from 1980 to 2002 shows spectacular growth. In total, seven states saw at least a five-fold increase in births to immigrant mothers between 1980 and 2002. In six other states the number grew more than four-fold, in 11 additional states the number tripled, and in another 18 states it more than doubled. Of course, in many states the number of native births also increased significantly as the states' overall populations grew. But even so, immigrants still have increased their share of births dramatically.
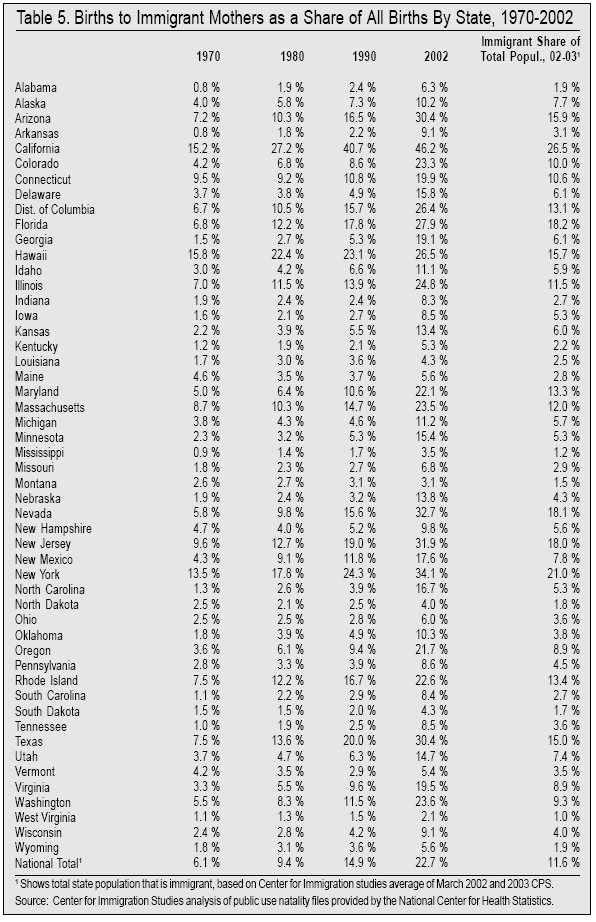
Percentage of Births to Immigrants by State. Table 5 reports the percentage of all births by state that were to immigrant mothers in 1970, 1980, 1990, and 2002. Between 1970 and 2002, there were three states -- North Carolina, Georgia, and Arkansas -- where immigrants increased their share of births at least 10-fold. In 12 other states, immigrants increased their share of births at least five-fold and in 21 states plus the District of Columbia the share tripled. In Georgia, the immigrant share of births increased seven-fold, from 2.7 percent in 1980 to 19.1 percent in 2002. In North Carolina, the increase was more than six times, increasing from 2.6 percent to almost 16.7 percent between 1980 and 2002. There were a total of eight states in which the immigrant share of births increased at least four-fold and 11 states where it tripled after 1980. There were also 18 states and the District of Columbia where the share of births to immigrants more than doubled. Even in states where a large percentage of births were already to immigrant mothers in 1980, immigrants still increased their share of births. In New York state, immigrants increased their share of births from 17.8 percent to slightly over 34 percent. And in California the immigrant share increased from 27.2 percent to 46.2 percent between 1980 and 2002. Tables 4 and 5 clearly show that the spectacular growth in births to immigrants has not been confined to a few states; it is a national phenomenon.
The last column in Table 5 reports the share of each state's total population that was foreign born in 2002. The figures for the total foreign born come from the March 2002 and 2003 Current Population Surveys (CPS) collected by the Census Bureau. Because the data for the total foreign born is based on a survey, we have averaged two years together to get a more accurate picture of the foreign born share in smaller states. Comparing the immigrant share of the total state population with the immigrant share of births produces some very interesting results for a number of states. Nationally, immigrants were 11.5 percent of the total population (11.6 percent when 2002 and 2003 data are averaged as in Table 5) and 22.7 percent of births were to immigrants in 2002. This is roughly a two-to-one ratio of births to immigrants. But, in some states the ratio is much larger. In Georgia and North Carolina, for example, the ratio of births to immigrants relative to their share of the total population is more than three to one. There are several possible explanations for this situation. The large number of births to immigrants in these states may mean that the undercount of the foreign born in the census is quite large. The issue of undercount is very complex, and much more detailed analyses would be needed in order to determine whether the immigrant population actually is much bigger in some states than the CPS indicates. Nonetheless, these results do make clear that in many states the number of births to immigrants is much larger than their share of the total population as shown in Census Bureau data. Simply looking at the share immigrants represent of the total population, without understanding their impact on births, may lead one to understate the actual impact of immigration policy on many states or American society as a whole.
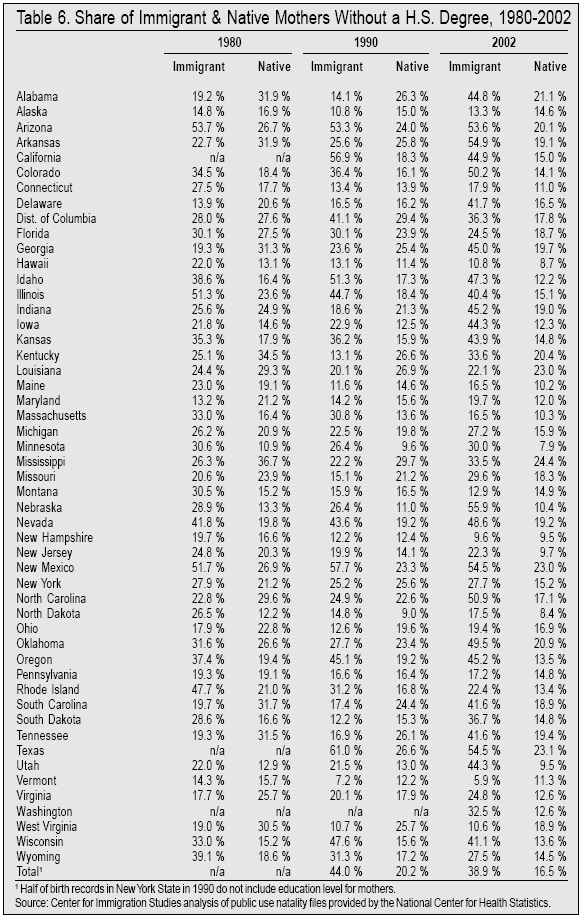
Education Level by State. Table 6 reports the share of immigrant and native mothers in 1980, 1990, and 2002 who lacked a high school degree for those states that collected the data. As already discussed, the education level of immigrant mothers is important because children of less educated parents are much more likely to live in or near poverty. They are also more likely to have special educational needs and to be at risk for dropping out of school themselves. As we saw in Table 1, very large differences exist between immigrant and native mothers in terms of the share without a high school education. The differences in education are also very large in most states. In 2002, there were eight states where immigrant mothers were three times as likely as native mothers to lack a high school education and 20 states in which immigrant mothers were more than twice as likely as natives to lack a high school education. One of the most striking things about Table 6 is the large number of states in which immigrant mothers actually become significantly less educated. There were 31 states in which the share of immigrant mothers without a high school education actually increased between 1990 and 2002. This despite the fact that the trend among natives and immigrants nationally is for an increasing percentage of new mothers to have completed high school.
In many of the states, the increase in the share of births to immigrant dropouts was enormous. In Alabama, Nebraska, Arkansas, Indiana, North Carolina, Delaware, Tennessee, South Dakota, South Carolina, Utah, Oklahoma, Iowa, Georgia, and Kentucky the share of immigrant mothers without a high school degree increased by more than 20 percentage points between 1990 and 2002. In contrast, the percentage of native mothers without a high school education improved in every state. In general, the states in which there was a deterioration in the share of immigrant mothers without a high school degree were also the states with the largest proportional growth in births to immigrants. Many of the states with the largest increase in births to immigrants are places where a very large share of new arrivals are from Latin America. As we have seen, Hispanic immigrants tend to have the lowest level of education. Thus, in areas of new immigration, the education level of immigrant mothers tended to fall significantly.
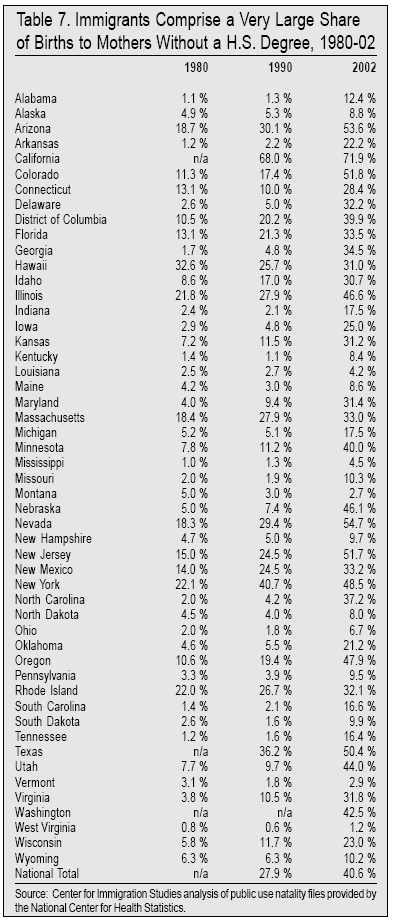
Immigrant Mothers as a Share of Dropouts. Table 7 shows the share of all high-school dropout mothers who are immigrants. The table indicates that immigrant mothers make up a very large percentage of births to mothers with little formal education across the country. In 1980 there were just six states in which immigrants accounted for more than 20 percent of births to dropouts. But by 2002 there were 28 states in which immigrants accounted for more than 20 percent of births to mothers with less than a high school education. While it may not be surprising that in states such California, Texas, and New York immigrants account for a large share of births to women with little education, it is very surprising to see that this is the case in states like Nebraska, Oregon, and Washington. As Table 6 showed, the share of native mothers completing high school has increased in these states, while immigrant mothers have become less educated at the same time as the number of immigrants has grown. Immigrants now account for a very large share of births to women who lack a high school degree. The impact of this growth on social services and schools in these states is likely to be very significant.
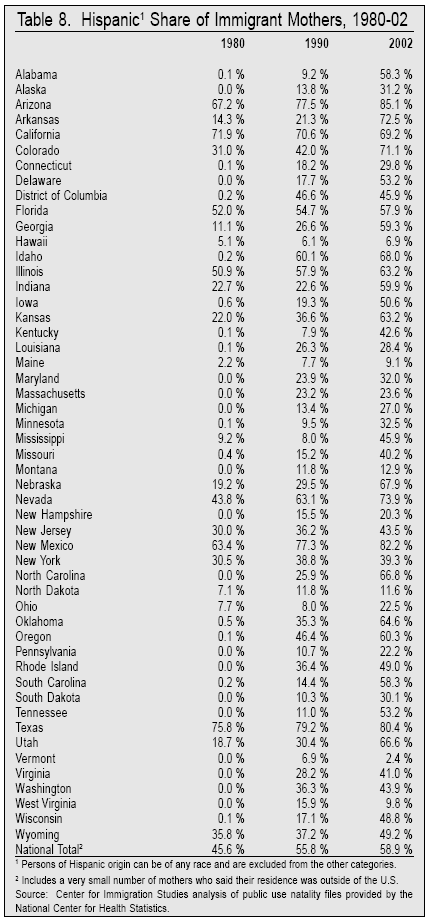
Hispanic Share by State. Table 8 shows the share of immigrant mothers who are Hispanic in each state. As we have seen in Table 2, Hispanics account for a growing share of births to immigrants nationally, increasing from 45.6 percent in 1980 to 58.9 percent in 2002. In 1980 Hispanic immigrants accounted for more than 40 percent of immigrant births in only seven states, but by 2002 this was the case in 32 states plus the District of Columbia. In fact, Hispanics actually doubled their share of births to immigrants in 21 states just since 1990. As already pointed out, the rapid increase in the Hispanic share of births to immigrants helps to explain why the overall education level of immigrant mothers deteriorated in many parts of the country. As Table 3 shows, Hispanics tend to have the lowest education levels of any immigrant group. As they increased their share of births to immigrants in many states, the education level of immigrant mothers declined. The rapid increase in the Hispanic share of immigrant births also means that the diversity of immigrant mothers has declined in many areas of the country.
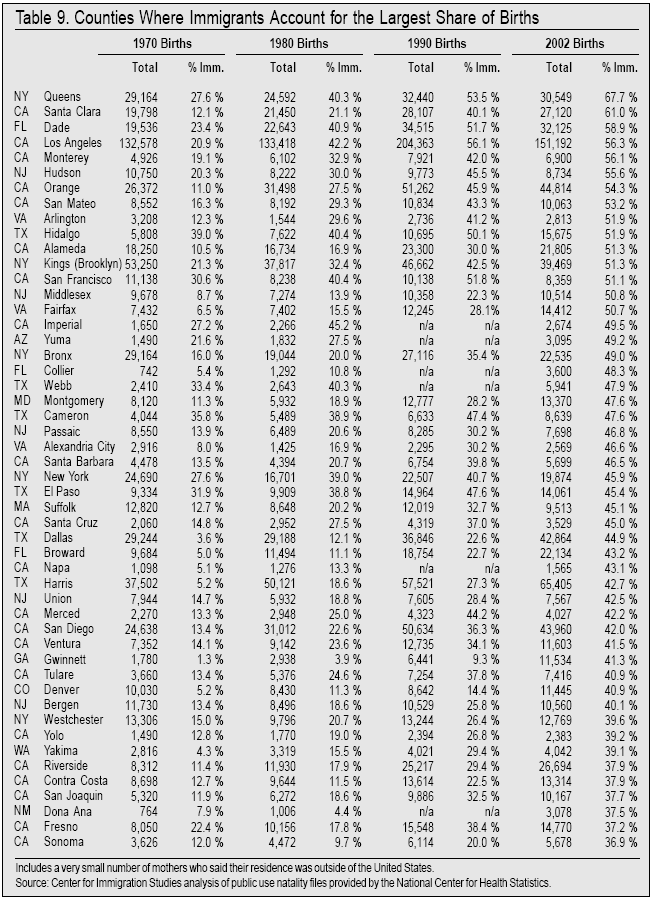
Immigration at the County Level. Table 9 shows the 50 counties in the country in which births to immigrant mothers comprised the largest share of births in 2002, as well as the percentage for 1990, 1980, and 1970. (While the public use natality data does not identify every individual county, information for 400 other counties for 1990 and 2002 is available at https://www.cis.org/sites/cis.org/files/articles/2005/back805data.xls ) Table 9 indicates that immigrants account for an enormous share of births in many counties. In 15 counties, immigrant mothers account for more than half of all births. While seven of these counties are in California, others are located in New Jersey, Florida, Virginia, and Texas. The counties run the range from primarily urban counties such as Los Angles, Calif., and Dade County, Fla., to suburban counties like Orange County, Calif., and Fairfax County, Va. In 2002, the top 15 counties accounted for 26 percent of all births to immigrant mothers in the United States, but only 6 percent of all births to natives.
Table 9 also shows that in some cases immigrants already accounted for a large share of births in 1970. In places like Los Angeles County, Dade County, and Queens, N.Y., immigrant mothers accounted for more than 20 percent of births in 1970. In other places, immigrants accounted for a relatively modest share of births in 1970 or even 1980, but the increase since then has been enormous. In Santa Clara, Calif., immigrants increased as a share of births from 12.1 percent of births in 1970, to 21.1 percent in 1980, and to 61 percent in 2002. In Collier County, Fla., they increased from 5.4 percent in 1970 to 48.3 percent in 2002. In Gwinnett County, Ga., the increase was 1.3 percent in 1970 to 41.3 percent in 2002; in Middlesex, N.J., the increase was 8.7 percent in 1970 to 50.8 percent by 2002; and in Fairfax County, immigrant mothers increased from 6.5 percent of births in 1970 to 50.7 percent in 2002. These counties are not alone. Other counties such as Alameda, Calif.; Dona Ana, N.M.; Dallas, Texas; Broward, Fla.; Napa, Calif.; and Alexandria, Va. saw similar growth rates between 1980 and 2002. There are now many areas where immigrants account for a very large share of births.
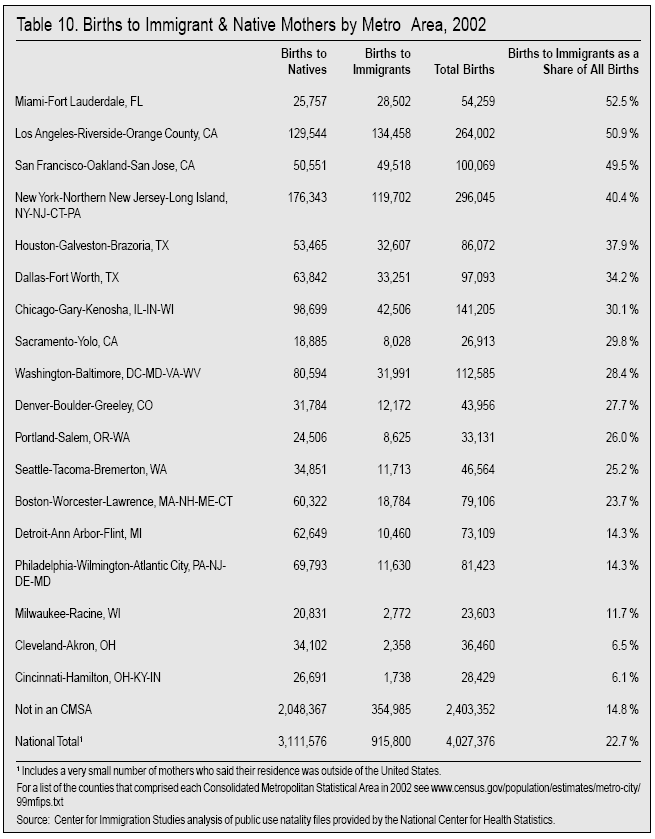
Metropolitan Areas. Table 10 shows the nation's Consolidated Metropolitan Statistical Areas (CMSAs) in 2002. The CMSAs are ranked based on the share of births to immigrant mothers in 2002. As expected, traditional areas of immigrant settlement have the highest share of births to immigrants. Half or more of births in the Miami, Los Angeles, and San Francisco CMSAs are to immigrant mothers. In New York it is 40.4 percent, and in Houston and Dallas more than a third of births are to immigrant mothers. It is striking that such a large share of births are to immigrants in these CMSAs because they cover very wide geographic areas, including inner and outer suburbs, and even rural areas. Thus even though the New York CMSA includes counties in New Jersey, Connecticut, and Pennsylvania, many of which are a good distance from New York City, more than 40 percent of births in the CMSA are to immigrants. Table 10 also shows that there is great variation in the number of births to immigrants across the country. In such major metropolitan areas as Detroit, Philadelphia, Milwaukee, and Cleveland, immigrant mothers account for a much smaller share of births than they do nationally.
Estimated Births to Illegal Aliens in States and Localities
In the methods section of the report we estimated the share of births to illegal alien mothers in 2002. Below we apply the same methodology to state and local data in order to estimate births to illegal aliens throughout the country. It must be remembered that the figures are estimates based on the characteristics of the mother. The numbers below should at least provide a good idea of the share of births to illegal aliens in 2002 in states and some local areas.
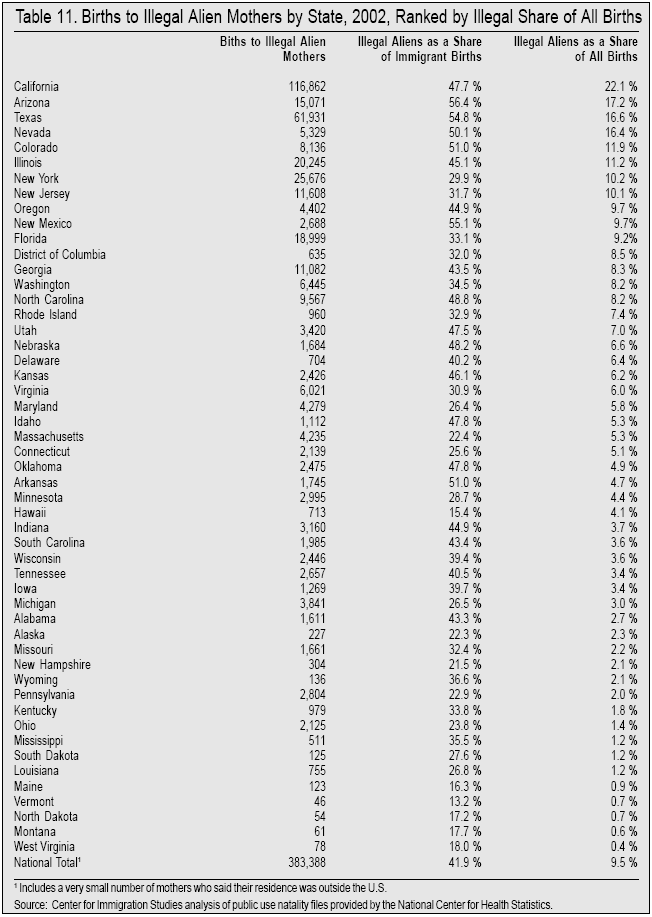
Estimated Births to Illegal Aliens by State. Table 11 ranks the states based on the estimated share of births to illegal-alien mothers by state. In six states, births to illegal-alien mothers account for more than 50 percent of births to immigrants, while in 15 states illegals were 40 percent or more of births to immigrants; in another 12 states plus the District of Columbia, illegal aliens comprised more than 30 percent of all births to immigrant mothers. Even in parts of the country that are often not associated with large-scale illegal immigration, births to illegal mothers still comprised a significant share of births to immigrants. Almost one fourth of births to immigrants in Ohio and Pennsylvania in 2002 were to illegal alien mothers. The table also shows that immigrants comprise a significant share of all births in a number of states. As already discussed, illegal-alien mothers are estimated to account for 9.5 percent of all births in the United States in 2002. Table 11 shows that there were 10 states in which illegals comprised more than 9.5 percent of all births. Whether 9.5 percent nationally or even higher percentages in some states is a "large" number is, of course, a matter of perception. But it is important to note that illegal aliens comprise about 3.6 percent of the nation's total population. Thus, the fact that in California they are estimated to account for more than one in five births and in three other states they account for one in six births is certainly consequential. The impact of illegal immigration on schools, hospitals, and social services generally is likely to be very significant for these states.
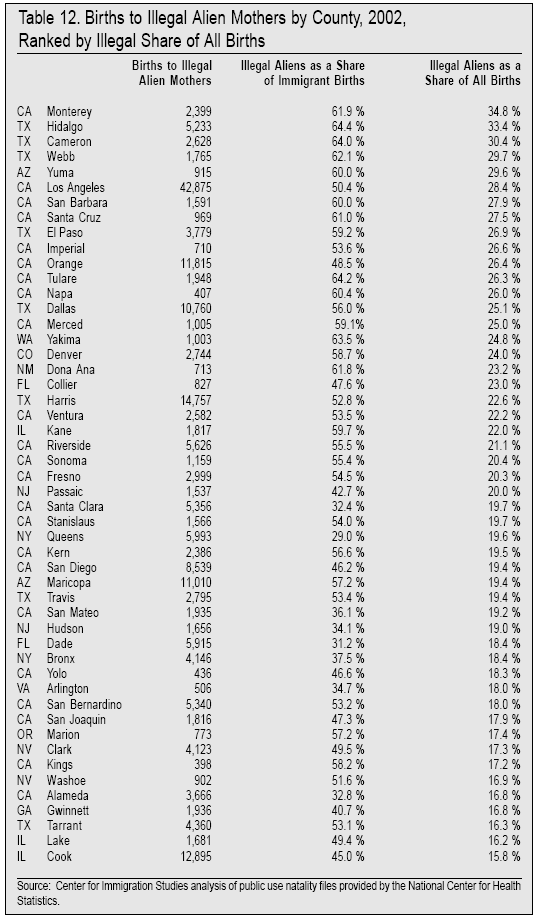
Estimated Births to Illegals by County. Table 12 shows the counties in which births to illegal immigrants are estimated to comprise the largest share of births. (While the public use natality data do not identify every individual county, information for 400 additional counties in addition to those in Table 11 is available at https://cis.org/sites/cis.org/files/articles/2005/back805data.xls. ) In almost every county listed in Table 12, illegal aliens account for a third or more of births to immigrant mothers. Many of most affected counties are in California or are counties near the Texas/Mexico border. In terms of absolute numbers, the most births to illegal mothers can be found in Los Angeles, where we estimate there were nearly 43,000 births to illegal aliens in 2002, accounting for half of births to immigrant mothers and 28 percent of all births in the county. But counties away from California and the border are impacted as well. For example, illegals are estimated to account for roughly half of births to immigrants in such geographically diverse places as Dallas, Texas; Yakima County, Wash.; Denver County, Colo.; and Collier County, Fla. They also account for about one in four of all births in these four counties. Table 12 shows that nationally there were a total of 26 counties in 2002 in which illegal alien mothers are estimated to account for one out of every five births: 13 in California, six in Texas, and one each in Arizona, Washington, Colorado, New Mexico, Florida, Illinois, and New Jersey. Illegal immigration is clearly having a very large impact on these counties.
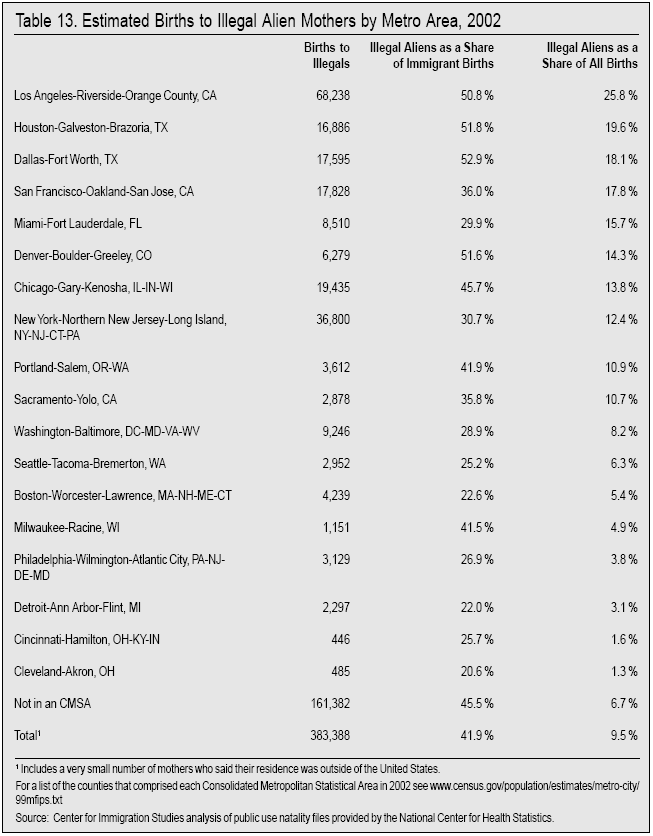
Estimated Births to Illegals by CMSA. Table 13 shows estimated births to illegal aliens in the nation's CMSAs. While CMSAs cover large areas, it is still striking to see that illegals account for one-third of births to immigrant mothers in nine CMSAs. It is also striking to see that they account for one in seven of all births in seven CMSAs. The data also show that areas of the country differ greatly in the share of births to illegal alien mothers. For example, while illegals are estimated to account for nearly 25 percent of all births in the Los Angeles CMSA and 20 percent in the Houston CMSA, they account for only about 3 percent of births in Detroit and 2 percent in Cincinnati. Although illegal aliens continue to spread throughout the country, our estimates of births show that many parts of the country remain relatively unaffected by illegal immigration.
Impact on Age Structure
The data presented so far indicate that immigrants have a very large impact on the number of births in the United States. Many advocates of high immigration point to such data and argue that immigration fundamentally changes the nation's age structure, and is very helpful in solving the problems of an aging society. However, a recent study by the Center for Immigration Studies, as well as estimates done by the Census Bureau and the Social Security Administration, show that immigration has only a very small impact on the aging of society now and in the future.18 While immigrants do tend to arrive relatively young, and have higher fertility than natives, immigrants age just like everyone else, and the differences with natives are not large enough to fundamentally alter the nation's age structure.
Impact of Immigration on Fertility and Age Structure. The fact that immigrants age over time, while obvious, is important because it partly explains why immigration does not significantly change the nation's age structure. The 2000 Census showed that the average age of an immigrant was 39 years, compared to 35 years for natives. One of the most important concerns of those worried about the aging of the country is that there will be too few workers relative to those who do not work. But the Census shows that in 2000, 66 percent of the nation's population was of working age -- 15 to 64. If all the immigrants who arrived after 1980 and all their U.S.-born children are excluded from the Census, the share of the population that is of working age would be virtually unchanged at 66 percent. Immigration adds to both the working-age population and the population too young or too old to work. As a result it has little impact on working age share.
The evidence is also clear that immigration has only a very modest impact on the nation's fertility rate. In 2000, our research shows that the nation's total fertility rate when immigrants are included is slightly under 2.1 children per woman. Without immigrants it would be 2.0 children per woman. The much higher fertility rate in the United States compared to Europe (1.4) and Japan (1.3) is not due to the presence of immigrants. Rather, it reflects the higher fertility of native-born American women, who continue to have significantly more children on average than their counterparts in other industrialized democracies. Again, immigration certainly adds to the number of births in the United States, but since more than three-fourths of births are still to natives, it is native fertility rates that mainly determine the overall fertility rate.
Immigration's Impact in the Future. The Census Bureau also has done projections assuming different levels of immigration. Those projections indicate that if net immigration was 100,000 to 200,000 annually, the working age share (15 to 64) would be 58.7 percent in the year 2060, compared to 59.9 percent in its middle immigration projections, which assume annual immigration of about one million. The Census Bureau itself states that immigration is "a highly inefficient" means for addressing a high ratio of working-age people relative to those too young or too old to work. Even focusing on working-age people relative to only retirees, excluding those under age 15, reveals little effect from immigration. The Census Bureau's low immigration projections show that in 2060, 27 percent of the adult population (age 15+) would be 65 or older, compared to 26 percent in their medium immigration projections. Although it has little effect on the share of the population that is of working age, immigration does make for a much larger overall population and a more densely settled country. The Census Bureau's middle immigration projections show that immigration will add 97 million people to the U.S. population over the next 60 years.19 But its impact on the aging of society can only be described as very modest.
Social Security. Census Bureau projections are buttressed by projections done by the Social Security Administration (SSA) which show that reducing legal immigration by 41 percent would increase the size of the program's funding deficit by only 2.5 percent. It is not clear that even this tiny effect exists, because SSA assumes that legal immigrants will have earnings and resulting tax payments as high as natives from the moment they arrive, which is contrary to a large body of research. The reason legal immigration has such a modest impact on Social Security is because immigrants do not arrive that much younger and their fertility is not that much higher than natives. The argument that immigration can have a significant impact on the aging of our society seems plausible. Immigrants tend to arrive in America relatively young and they also tend to have more children than natives. But an evaluation of the actual data shows that the difference between immigrants and natives is not sufficiently large, nor are immigrants sufficiently numerous to be of any real help in changing the nation's age structure. While there is no doubt that immigration dramatically increases the number of children born in the United States, Americans will simply have to look elsewhere to deal with the challenges of an aging society.
Conclusion
Historical Comparison. The findings of this report show that America is headed into uncharted territory when it comes to births to immigrants. Even at the peak of the last great wave of immigration in 1910, births to immigrant mothers accounted for a slightly smaller share than today. Perhaps most important, after 1910 immigration was reduced by WWI and then restrictive legislation in the 1920s. But current immigration continues at record levels, thus births to immigrants will continue to increase, absent a change in U.S. immigration policy. With over 900,000 children now born to immigrant mothers each year, the stakes for the country are clearly enormous. Political scientist Peter Skerry has pointed out that, "A virtual truism of the immigration literature is that the real challenges to the receiving society arise not with the relatively content first generation, who compare their situation with what was left behind, but with the second and third generations, whose much higher expectations reflect their upbringing in their parents' adopted home."20 In his 1979 book Birds of Passage, Michael Piore traces the labor unrest of the great depression to the children of European immigrants. He also points out that it was the children of blacks migrants from the south who rioted in northern cities during the 1960s, not the immigrants themselves. This study does not directly answer the question of whether the children of immigrants are assimilating at a satisfactory pace. What we can say is that America has never attempted to assimilate so many second-generation children.
Declining Diversity. The study finds that the increase in births to immigrants has been accompanied by a significant decline in the diversity of immigrants. One county, Mexico, and one region of the world, Latin America, have come to dominate births to immigrants. Mexican mothers have increased their share of immigrant births from 24 percent in 1970 to 45 percent by 2002. Hispanic immigrants overall have increased their share of births from 46 percent in 1980 to 59 percent in 2002. In contrast, the top sending country in 1910 accounted for only 18 percent of births to immigrants. America is entering a new time, heretofore unknown, in which one group is dominant among immigrants.
Births to Illegal Aliens. We estimate that 383,000, or 42 percent, of births to immigrant mothers were to illegal alien mothers in 2002. Births to illegals now account for nearly one out of every 10 births in the United States. The large number of births to illegals shows that the longer illegal immigration is allowed to persist, the harder the problem will be to solve; as U.S. citizens these children have a right to stay permanently, their citizenship can prevent a parent's deportation, and once adults they can sponsor their parents for green cards. The large number of children born to illegals also shows that a "temporary" worker program is unrealistic. It would result in hundreds of thousands of permanent additions to the U.S. population each year, exactly what such a program is supposed to avoid. Births to illegal aliens remind us that illegals are not simply workers, but rather they are human beings who, like all people, will have children. This fact alone means that tolerating widespread illegal immigration has enormous long-term consequences for our country.
Impact on the Nation's Age Structure. Immigrants account for such a large percentage of births because they have somewhat higher fertility and are more likely to be in their reproductive years than natives. However, the differences with natives are not large enough to significantly affect the nation's overall age structure. The 2000 Census showed that 66 percent of the nation's population was of working age (15 to 64). But if all the immigrants who arrived after 1980 and their U.S.-born children had not come to America, the Census shows that the working age share would be virtually unchanged at 66 percent. Immigration adds to both the working-age population and the population not of working age. While it has little effect on the nation's age structure, immigration and births to immigrants has added roughly 28 million people to the nation's population between 1980 and 2000, making for a much more densely settled country.
The costs and benefits of immigration continue to be the subject of intense debate. With more than 900,000 children born to immigrants each year, the successful assimilation and incorporation of the children of immigrants has become very important to the future of the country. But the dramatic increase in births coupled with declining diversity may make it much more difficult to assimilate these children.
End Notes
1 The U.S. Supreme Court has never directly decided whether the citizenship clause of the 14th Amendment of the Constitution covers the offspring of illegal aliens and other non-permanent residents. It also has never ruled whether Congress has the power to exclude children born to illegal aliens and other non-permanent residents from U.S. citizenship. The Court did rule in U.S. v Wong Kim Ark. 169 US 649, in 1898, that the children of legal permanent residents were automatically citizens. For a summary discussion of the issues surrounding immigrants and citizenship see Charles Wood, "Losing Control of America's Future -- The Census, Birth Right Citizenship, and Illegal Aliens." Harvard Journal of Law and Public Policy. Vol. 22, Pages 493-519, Spring 1999.
2 See "National Vital Statistics, Births: Final Data 2002," Vol. 52 number 10 page 3. www.cdc.gov/nchs/data/nvsr/nvsr52/nvsr52_10.pdf
3 We follow the example of NCHS in its reports and weight the data from the seven states to reflect the total number of births in 1980.
4 Although very small in number, the children of diplomats are the one group who are not automatically granted citizenship, and some mothers who indicate that they reside abroad are probably on diplomatic visas. However, an analysis of the education level and country of birth for these mothers indicates that relatively few are diplomats. Moreover, hospitals that resister births do not ask if the mother is a diplomat, thus it is not at all clear that the tiny number of children born to diplomats are in fact excluded from citizenship.
5 While our definition of foreign born is close to that used by the Census Bureau, the Bureau considers persons born in other countries to American citizen parents as natives. Unlike Census data, however, NCHS data do not include a question that asks respondents if they were born abroad of American parents and therefore such persons cannot be distinguished from others born in foreign countries.
6 The 2002 Current Population Survey (CPS) showed 32.45 million immigrants and the 2003 CPS showed 33.5 million. If the growth rate was constant between 2002 and 2003, then the total foreign-born population was 32.7 million in June of 2002. We adjust this number upward by 1.5 million to account for immigrants missed by the CPS, creating a total foreign-born population in June of 2002 of 34.1 million, or 5.4 percent higher than the unadjusted total for March of 2002. We adjust this number assuming an 8 percent undercount for Mexican immigrants, a 7 percent undercount for non-Mexican Hispanics, and a 2.5 percent undercount for all others.
7 We estimated that there were 2.8 million illegal alien women between the ages of 18 and 39 in 2002, 60 percent of whom are Mexican. Of Mexican women in this age group, we estimate that 69 percent lacked a high school degree. Overall, illegals 18 to 39 account for 95 percent of births to illegal alien mothers. We also estimate a very small number of births to illegal alien women under age 18 and over age 39.
8 Like almost all researchers in this field, we use Census Bureau data to determine the size and characteristics of illegal immigrants. Using the citizenship status, year of arrival in the United States, age, country of birth, educational attainment, sex, receipt of welfare programs, receipt of Social Security, veteran status, and marital status reported in the Current Population Survey (CPS), we assign probabilities to each survey respondent. Those individuals who have a cumulative probability of 1 or higher are assumed to be illegal aliens. The probabilities are assigned so that both the total number of illegal aliens and the characteristics of the illegal population closely match other research in the field, particularly the estimates developed by Jeffery Passel, formerly of the Urban Institute and now at the Pew Hispanic Center. This method is based on some very well-established facts about the characteristics of the illegal population. For example, it is well known that illegals are disproportionately young, male, unmarried, under age 40, have few years of schooling, etc. We adjust the number of illegals in the CPS up by one million and estimate a total illegal population of 9.44 million in June of 2002. We further estimate that 30.5 percent of the illegal population were women in their primary reproductive years (18 to 39) and that the illegal population is 60 percent Mexican. We also estimate that 23 percent are from Latin American countries other than Mexico and that the remainder of the world accounts for 17 percent of the total.
9 We believe that there is little difference in the fertility of legal residents and illegal aliens, controlling for other demographic characteristics, because survey data show a large number of births to recently arrived immigrants from Latin America, who are overwhelming illegal. For example, it is well established that the vast majority of Mexican immigrants in 2000 who arrived in 1990 or later are illegal aliens. The Urban Institute has estimated that in 2000, 80 percent of the Mexican population that arrived after 1990 were illegal aliens, while only 10 percent of the pre-1980 Mexican immigrant population was illegal. Our analysis of the June 2000 Current Population Survey, which is designed to measure fertility and includes a question on year of arrival in the United States, shows that post-1990 Mexican immigrant women age 20 to 40 have fertility rates that are similar to Mexican women who arrived prior to 1990. If illegals had substantially different fertility, then the fertility of these two groups should differ significantly, but they do not.
10 These figures reflect the 1970 decennial Census and the March 2002 Current Population Survey. Neither figure has been adjusted for undercount.
11 Because our estimates for illegal immigrants discussed earlier required detailed birth rates for 2002, we carry counts from the March 2002 Current Population Survey forward to mid-1980 and adjust the totals to reflect undercount by ethnicity. However, in our discussion of changes in immigrant and native birth rates between 1970 and 2002 we make straightforward comparisons with Census counts and do not adjust for undercounts because no historical estimates of undercount of the foreign born going back to 1970 exist. Nonetheless, simple comparisons of this kind should still provide a reasonable estimate of the changes in age structure and fertility among immigrants and natives.
12 The 1910 Census asked respondents in what country the child's mother was born. This is essentially the same question as birth records, making it is possible to make a reasonable comparison between 1910 and today.
13 Figures based on author's analysis of March 2002 Current Population Survey. Young children are those under age six, and low income is defined as between 100 and 200 percent of the poverty threshold. For natives the figures are very similar. It is the education level of these parents that places their children at very high risk for being in or near poverty, not whether the parent is foreign born.
14 Summarizing other research, a 1998 report by the Council of Economic Advisors states, "parents' education is associated with better health, development, and educational attainment for their children." The report is at www.access.gpo.gov/eop/ca/pdfs/ca.pdf
15 In 2002, 21 percent of Hispanic natives age 20 to 25 had not completed high school compared to 11 percent of other natives. Figures based on author's analysis of March 2002 Current Population Survey.
16 The 1970 birth data do include a category for "other western hemisphere" for foreign-born mothers. While this would include non-Hispanic countries, primarily in the Caribbean, it is possible to use this question to estimate the share of births to immigrants that are to Hispanics other than Mexicans and Cubans.
17 In previous research we have estimated that 65 percent of illegal immigrants do not have health insurance. See Table 6 in "Economy Slowed, But Immigration Didn't: The Foreign-Born Population, 2000-2004," at https://cis.org/sites/cis.org/files/articles/2004/back1204.html . Therefore we estimated that there were 249,000 births to uninsured illegal immigrant mothers in 2002. The average cost of a birth in 2002 was about $8,000, according to National Inpatient Sample. This comes to nearly $2 billion in costs for uninsured illegal immigrant mothers. Research by Jack Hadley and John Holahan indicates that 87 percent of the costs of care for the uninsured comes from government, the remainder coming from the uninsured themselves, charity, and health care providers. Their February 2003 article in Health Affairs, "How Much Medical Care Do The Uninsured Use, And Who Pays For It?" can be found at, www.healthaffairs.org . Assuming that government pays for 87 percent of the cost of births to illegal aliens, then the cost to taxpayers is an estimated $1.7 billion in 2002.
18 The report "Immigration in an Aging Society: Workers, Birth Rates, and Social Security" can be found at https://cis.org/sites/cis.org/files/articles/2005/back505.html
19 Census projections showing the impact of immigration on the working-age share of the population with different levels of immigration can be found at www.census.gov/population/www/documentation/twps0038.pdf . See Table F.
20 Professor Skerry's essay, "Do We Really Want Immigrants to Assimilate?" can be found at https://cis.org/sites/cis.org/files/articles/1998/what.pdf
