Download this Backgrounder as a pdf
The last 30 years have witnessed a steady increase in immigration to the United States. An estimated 1.3 million legal and illegal immigrants now settle in the country each year. In the past, immigrant settlement has been mostly confined to relatively few states, with California, New York, and Florida accounting for more than half of the nation’s foreign-born population. While immigrants still tend to be concentrated in only a handful of states, there is growing evidence that they are increasingly settling in areas that until recently were largely unaffected by immigration. While the full results from the 2000 Census will not be available for some time, this Backgrounder attempts to identify new areas of immigrant settlement based on analysis of immigrant arrival data provided by the Immigration and Naturalization Service (INS). It compares the size of the foreign-born population in the 1990 Census with the number of new legal immigrants (those receiving green cards) who arrived from abroad between 1991 and 1998, as determined by the INS. Excluding counties with very small immigrant populations, those counties in which the number of new legal immigrants (1991-1998) was equal in size to at least 50 percent of the existing foreign-born population in 1990 are designated as "New Ellis Islands."1 Detailed data for all counties are available here:
Detailed Information for Every County
Detailed Information for the Nation's 100 Largest Metropolitan Areas
Among the findings:
- One out of 14 counties in the United States — 223 of the 3,141 that comprise the U.S. — met the criteria of a New Ellis Island. While these counties can be found throughout the United States, the new areas of immigrant settlement are overwhelming in the South, which has 131, and the Midwest, with 75 counties.
- The state with the most counties identified as New Ellis Islands is Georgia, with 25, followed by Minnesota and Kentucky with 18 counties each. Virginia has 13 such counties, while Tennessee and North Carolina have 12 each. Indiana is home to 11 New Ellis Islands, while Mississippi, Missouri, and Iowa have 10 counties each. Texas, Alabama, Louisiana, Illinois, and Colorado each have at least 5 counties that qualify as new Ellis Islands.
- Of the states that traditionally have attracted immigrants, only Texas and Illinois, with 9 and 6 New Ellis Islands respectively, have a significant number of these counties. Because the existing immigrant populations were already so large in 1990, not one county in California, New York, or Arizona, and only one county each in Florida and New Jersey, meet the definition of a new Ellis Island.
- Among the 223 counties that are the New Ellis Islands, some are dominated by only a few immigrant sending countries; in 62 (28 percent) of these counties, the top-sending country accounts for at least half of the immigrants who arrived in the 1990s. However, in other counties, no single sending country predominates. There were 83 counties (37 percent) in which no single sending country accounts for more than 25 percent of 1990s immigrants.
- While by no means true for every county, in general the new areas of immigrant settlement tend to be associated with either immigration from Mexico or India or with refugee resettlement. Mexico is the leading sending country in 82 counties (37 percent) that qualify as New Ellis Islands. It is followed by India, which is the top-sending country in 35 counties (16 percent). Refugee-sending countries (primarily Vietnam and the former Soviet Union) are the leading sending countries in 50 counties (22 percent).
- In the nation’s 100 largest metropolitan areas, Nashville ranks first in the number of new immigrants (1991-1998) relative to its foreign-born population in 1990. Atlanta is second and Louisville is third. Rounding out the top ten are Minneapolis-St. Paul, Greensboro-Winston-Salem, Charlotte, Memphis, Portland-Vancouver, Seattle, and Washington, D.C.
The spread of immigrants to areas where there had been little immigration prior to the 1990s will likely continue. The networks of families and friends now being established in these communities will almost certainly draw even more immigrants to these areas. In addition to drawing in legal immigrants, these networks will also likely attract increasing numbers of illegal immigrants. Sociological research indicates that legal and illegal immigration are intimately linked and not the separate phenomena that is commonly supposed. For example, studies of migration indicate that one of the primary factors influencing a person’s decision to emigrate is whether a family member or member of their home community has already come to United States.2 With 13 million new legal and illegal immigrants expected in the next decade alone, the impact of immigrants on many of the New Ellis Islands will only grow if current policies remain in place.
Methodology
To identify new areas of immigrant settlement, we first examine 1990 Census results to report the size of the foreign-born population for all 3,141 counties and independent cities in the United States. Second, utilizing public-use data from the INS showing county of intended residence, we then compare the number of new legal immigrants (those receiving green cards) who arrived between 1991 and 1998 with the size of the 1990 foreign-born population in each county. This comparison is reflected as a percentage. For example, if a county had a foreign-born population of 1,000 in 1990 and 500 new legal immigrants arrived between 1991 and 1998, then the county was assigned a value of 50 percent.
Because we are interested only in new arrivals, those legal immigrants who received their green cards (permanent residency visas) between 1991 and 1998, but had actually entered the country on a temporary visa prior to 1990 are excluded.3 It is possible to confine our analysis to only the 5.5 million immigrants who arrived between 1991 and 1998 because public-use INS data have year of arrival data for persons who arrived on temporary visas and subsequently adjusted to permanent status. For example, an individual who arrived in 1988 on a student visa and later married an American and obtained a permanent residency visa in 1995 would be excluded from our totals for 1991-98 because he was counted in the 1990 Census. However, we do include those persons who arrived on a temporary visa after 1990 and subsequently adjusted to permanent legal status between 1991 and 1998. In this way we can confine our analysis to only those new legal immigrants who arrived between 1991 and 1998.
We excluded counties with fewer than 50 immigrants in 1990 and then placed each country in one of four categories based on its percentage. Those counties in which the number of new legal immigrants (1991-1998) was equal to more than 50 percent of the existing foreign-born population in 1990 were designated as "New Ellis Islands."
The relative level of new immigration to these counties is much higher than is the national average. In 1990, the total foreign-born population in the United States was 19.8 million, and between 1991 and 1998, 5.5 million new legal immigrants arrived in the country. This means that nationally the number of new legal immigrants was equal to 28 percent of the size of the existing foreign-born population in 1990. While most of the study focuses on those county designated as New Ellis Islands, we further classify counties into three other categories: those experiencing 25 to 49 percent growth in their immigrant populations; 15 to 24 percent growth; and 0 to 14 percent growth. The map in the center of this Backgrounder reflects these categories.
While we are confident that our methodology captures those areas that are receiving a large influx of new immigrants relative to the existing immigrant population, there are limitations to this approach. First, the study compares the size of the 1990 foreign-born population, which includes a significant number of illegal aliens, to only newly arrived legal immigrants. Thus, the size of the impact on each county is probably understated because the arrival figures for 1991 through 1998 do not include new illegal aliens while the 1990 figures to which they are compared do include some illegals. Second, some of the new legal immigrants who show up in the data as new arrivals between 1991 and 1998 are in fact illegal aliens who came to the United States prior to 1991 and should have been counted in the 1990 Census. This would tend to overstate the impact of new immigration since these individuals are not new arrivals but instead are already living in the United States. In general, however, this approach should be useful in identifying those areas in which the level of immigration in the 1990s represents a clear break with the recent past.
Discussion
The Map. The map that follows is a graphical representation of the above methodology. The map reveals some very interesting patterns. While the New Ellis Islands can be found throughout the country, they are concentrated in the South and Midwest. In the South, a very large share of the counties in Georgia, North and South Carolina, Virginia, and Maryland qualify as either New Ellis Islands or the level of new immigration in the 1990s there is equal to between 25 and 49 percent of the foreign-born population in 1990, placing them in our second category.
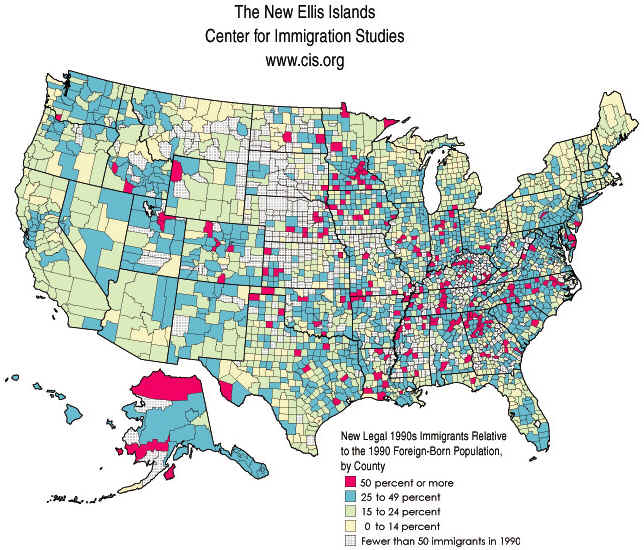
Kentucky and to a lesser extent Tennessee have a number of New Ellis Islands and also a large number of counties in which the existing immigrant population was very small in 1990 and in almost all cases remains very small. Thus, new areas of immigration in these two states really are "islands" in that they are surround by areas of low immigration. In the Midwest, Minnesota, Iowa, and Indiana not only have a large number of New Ellis Islands, but also a large number of counties in which the ratio of new to existing immigrants is in our second category of 25 to 49 percent. The map also indicates that there are many parts of the country in which immigration remains very low. Western Pennsylvania, Wisconsin, Montana, the western Dakotas, and much of New England and upstate New York have few immigrants, and the level of immigrants to these areas in the 1990s has generally been low.
Regional Distribution. Table 1 delineates the distribution of counties across the regions of the country based on the ratio of new immigrants to the 1990 foreign-born population. Like the map, the table shows that the New Ellis Islands are overwhelmingly concentrated in the South and Midwest. Excluding counties with fewer than 50 immigrants in 1990, almost 12 percent of the counties in the South and 10 percent of the counties in the Midwest can be described as New Ellis Islands. Even looking at those counties in which the number of new legal immigrants is equal to between 25 and 49 percent of the 1990 foreign-born population, we see that a much larger share of counties in the Midwest and the South also fall into this category. However, the West also has a number of counties in which the level of new immigration is in this second category. With one-third of the counties in the Northeast, the number of new legal immigrants is equal to between 25 and 49 percent of the foreign-born populations there in 1990. Although the relative level of new immigration in these areas may not be as large as that in the South and Midwest, large areas of the Northeast and the West are also experiencing a level of immigration that is very different than what had been true in the recent past.
The Top Counties. Table 2 ranks the top 25 counties based on the number of new legal immigrants relative to the size of the foreign-born population in 1990. These New Ellis Islands with the highest percentages of new immigrants tend to be those in which the existing immigrant population was small in 1990. Of course, the impact of immigration may be significant on these counties because their overall populations also tend to be small. Most of the counties on the list had fewer than 25,000 inhabitants in 1990. For example, the 245 immigrants who arrived in the 1990s in Nantucket County, Massachusetts, are equal to 4 percent of the county’s entire population in 1990. An examination of the leading sending-countries found in the table indicates that new areas of immigrant settlement tend to be associated with Mexican and Indian immigration or refugee resettlement. Mexico is one of the top-three sending countries in 17 of the 25 counties in Table 1, and India is one of the top three sending-counties in six of the counties. Additionally, at least one refugee sending country is represented in the top three sending-counties in more than half the counties.4
Table 3 examines the New Ellis Islands from a different perspective. The table ranks the top 25 counties based on the number of immigrants who entered between 1991 and 1998. Again, all the counties in the table qualify as new Ellis Islands. Only Minnehaha County in South Dakota and Cass County in North Dakota are in both Tables 2 and 3. Overall, the ratio of new immigrants to the 1990 foreign-born population tends to be somewhat lower in Table 3 than in Table 2. While the ratio is somewhat smaller than in Table 2, the impact of immigration on all of these counties is likely to be very significant.
In Fort Bend County, Texas, the number of legal immigrants who arrived in just the 1990s is equal to 6 percent of the county’s entire population in 1990, and in Fairfax City, Virginia, the number of newly arrived legal immigrants was equal to 9 percent of the entire city’s 1990 population. This is truly striking because Fairfax City was already 15 percent foreign-born in 1990. While Fairfax City already had a significant immigrant population in 1990, this was less the case for counties such as DeKalb County, Georgia, where the foreign-born were 7 percent of the county’s total population in 1990. The 19,221 new legal immigrants who entered the county in the 1990 were equal to 4 percent of the county’s entire 1990 population.
With respect to country of birth data in Table 3, we see some differences in comparison to Table 2. While Mexico was one of the top three sending-counties in Table 2, this is not the case with Table 3. Refugee sending-counties in this table emerge as the dominant sending-countries. For example, Mexico is the top sending-country in only Finney County, Kansas. In contrast, Vietnam, the former Soviet Union, and Ethiopia are the top sending countries in 18 of the 25 counties in Table 3. Mexico in Table 3 is one of the top three sending-counties in only seven counties, compared to its status as a top sender for 17 of the counties in Table 2. Unlike Mexico, India is about as prominent in Table 3 as it is in Table 2. Overall however, Table 3 indicates again that the New Ellis Islands tend to be associated with Mexican and Indian immigration or refugee resettlement.
Metropolitan Areas
Using the same basic methodology as above, we also ranked the nation’s 100 largest Metropolitan Statistical Areas (MSAs). Table 4 reports the top 25 MSAs ranked by the number of new immigrants (1991-1998) relative to the size of their 1990 foreign-born populations. The top city of new immigration is Nashville, Tennessee, followed by Atlanta, Georgia, and Louisville, Kentucky. Not surprisingly, many of the cities can be found in the South. Of the 25 metropolitan areas in the list, 13 are in the South. In addition, five are in the Midwest, four are in the West, and three are in the Northeast. Analysis of the top sending countries shows that in most of these cities, refugee-sending countries lead the list. Vietnam or the former Soviet Union are the leading sending countries in 20 of the 25 metro areas. There is also significant diversity in legal immigration in most of the these areas. In only three of the cities does the top sending country account for 25 percent or more of legal immigration. Table 4 makes clear that there are a number of major metropolitan areas that are experiencing significant immigration that until recently were largely unaffected by immigration.
Conclusion
The study almost certainly understates the impact of 1990s immigration on each county or metro area because the arrival figures for 1991 through 1998 do not include new illegal aliens, while the 1990 figures to which they are compared do include some illegals. Overall our findings show that while there are still areas of the country that are unaffected by immigration, these areas are becoming fewer and fewer. The New Ellis Islands are primarily in the South and Midwest, with Georgia, Minnesota, and Kentucky having the most such counties. While no one pattern predominates, in general the New Ellis Islands in the South tend to be associated with Mexican immigration, while those in the Midwest are often the result of refugee resettlement.
It is likely that without a change in immigration policy, additional communities will become New Ellis Islands in the decades to come. Moreover, in the areas of new immigrant sentiment identified in this study the level of immigration will almost certainly continue to increase as the networks of family and friends now in place draw in more legal and illegal immigrants. This means that many parts of the country that did not have a stake in the national debate over immigration now have a keen interest in immigration.
End Notes
1 Approximately three-quarters of immigrants to the U.S. during the Great Wave of Immigration in the late 19th and early 20th centuries arrived at the port of New York City. The federal facility of Ellis Island, an old naval arsenal, was built in 1892 to accommodate the flow of more than one million immigrants annually. Ellis Island became the gateway to America for tens of millions of immigrants until the 1930s, when it became a detention center. In 1965, Ellis Island reopened in as an immigration museum overseen as part of the Statue of Liberty National Monument. Years of weather-related decay in New York Harbor led to its being refurbished in the 1980s, and in September 1990 the site was reopened to the public.
2 Massey, Douglas S.; Kristin E. Espinosa. 1997. "What’s Driving Mexico-U.S. Migration? A Theoretical, Empirical, and Policy Analysis." American Journal of Sociology. 102: No. 4 939-999. Palloni, Alberto, Mike Spittel, and Miguel Ceballos. 1999. "Using Kin Data to Falsify Social Networking Hypotheses in Migration." Paper presented at the annual meeting of the Population Association of America.(Massey and Espinosa 1997; Palloni, Spittel, and Ceballos 1999).
3 We also exclude all amnesty beneficiaries who received green cards between 1991 and 1998 as part of the Immigration Reform and Control Act (IRCA) passed in 1986.
4 It should be pointed out that although an immigrant may come from a country that has sent a large number of refugees, they themselves may not have entered as refugees. Even so, non-refugees from these counties are mostly family members and others from the same community joining those who came earlier as refugees. Thus, this family-based immigration is clearly a direct result of refugee resettlement efforts.
Steven A. Camarota is Director of Research and John Keeley is Research Associate at the Center for Immigration Studies.