The findings reported here show that the labor force participation rate — the share working or looking for work — of U.S.-born men of working-age has declined for six decades in nearly every state, especially for men without a bachelor’s degree. While participation has roughly returned to pre-pandemic levels in most states, the rate in 2019, before Covid, was extremely low by historic standards. Because they are not actively looking for a job, those out of the labor force are not counted as unemployed. As discussed in a much larger companion report that looks at trends nationally, the causes for the fall-off are much-debated. But there is agreement that the decline contributes to serious social problems, including suicide, crime, drug overdoses, and welfare dependency. Drawing some of the tens of millions of working-age Americans on the economic sidelines back into jobs should be a national priority, but many political leaders, including in states where the decline is very large, instead advocate bringing in more immigrant workers.
Among the findings:
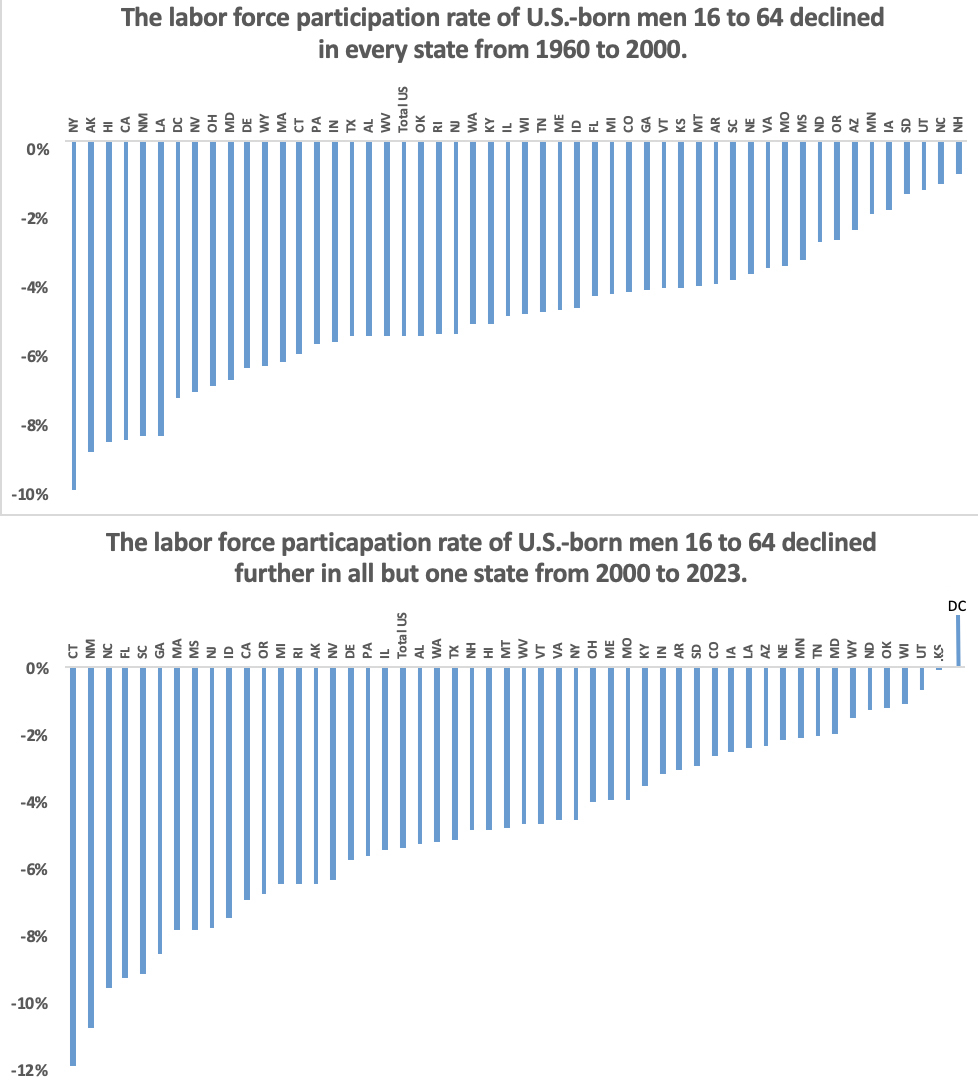
- In every state, the labor force participation rate of working-age (16 to 64) U.S.-born men was lower in 2000 than in 1960. In 49 states, except Kansas, the rate declined further from 2000 to 2023.
- The largest declines from 1960 to 2000 were in New York, Alaska, Hawaii, California, New Mexico, Louisiana, Nevada, and Ohio. The biggest declines since 2000 have been in Connecticut, New Mexico, North Carolina, Florida, South Carolina, Georgia, and Massachusetts.
- In 1960, there were 44 states where the participation rate for U.S.-born men (16 to 64) was above 85 percent compared to just five states by 2023. Also, the rate was higher than 80 percent in every state in 1960, but by 2023 this was the case in just 17 states.
- Excluding the young and those who might have retired early, and looking only at U.S.-born men of “prime age” (25 to 54), shows a labor force participation decline in every state from 1960 to 2000 and a further decline in 42 states from 2000 to 2023.
- In 1960, there were 37 states where more than 95 percent of prime-age, U.S.-born men were in the labor force, compared to just one state, Minnesota, in 2023.
- While traditionally lower than men, the participation rate for women (16 to 64) increased dramatically from 1960 to 2000 as women entered the labor force in huge numbers, but since 2000 the rate for women has fallen somewhat nationally and in most states.
- The decline in labor force participation of working-age, U.S.-born men (16 to 64) is most pronounced among men without a bachelor’s, declining in every state from 1960 to 2000 and from 2000 to 2023.
- The average decline in labor force participation for U.S.-born men (16 to 64) without a bachelor’s was nearly 15 percentage points across states from 1960 to 2023, compared to 10 percentage points for U.S.-born (16 to 64) men of all education levels.
- Like their less-educated male counterparts, the participation rate of working-age (16 to 64) U.S.-born women without a bachelor’s has declined nationally since 2000 and in all but one state.
- In general, working-age immigrant men and women do not show a pattern of consistent decline. However, immigrant men (16 to 64) without a bachelor’s do show some decline nationally and in 29 states since the peak in 2006, before the Great Recession.
Excel State Level Labor Force Participation Data Can Be Found Here
Discussion. For more discussion of the issues surrounding labor force participation see, our large new study on that topic. As we point out in that study, there are an enormous number of interest groups, politicians, opinion writers, and others arguing that due to the low unemployment rate, the aging of society, or the number of unfilled jobs, the nation requires significantly more immigration. But as we show at the national level, and in this report at the state level, labor force participation remains extremely low in most of the country, particularly for U.S.-born men. Those in the labor force are working (full- or part-time) or they are looking for work. Those outside the labor force are neither working nor looking for work and are not counted as unemployed because they are not actively seeking a job. This excel file contains state-level labor force participation information.
The Data. This analysis is based on public-use decennial census data from 1960 to 1990, along with the March, April, and May Current Population Surveys (CPS) for the peak years of 2000, 2006, 2019, and 2023. The decennial Census no longer asks about citizenship and it only provides information every 10 years, so it does not perfectly correspond to peak years of participation between recessions. But it is the only nativity data going back decades. The census is conducted in April, so using a three-month sample with April as the middle month provides robust state level estimates that match the same time of year as the decennial census. However, it should be noted that for some smaller states with small immigrant populations, the sample is still small and should be interpreted in that context, particularly decades ago when immigration was much less. We exclude those in institutions (primarily prisons and jails), and we focus on men because, unlike women, men have not been heavily impacted by the profound social, cultural, and legal changes that caused an ever-larger share of women to join the labor force, at least through 2000. Men, on the other hand, have experienced a well-documented decline in labor force participation, and there is an accompanying body of research showing the harmful effects of the decline. Of course, we also report figures for women.
We use the term “immigrant” in this report synonymously with “foreign-born”. This includes all those who were not U.S.-citizens at birth, including illegal immigrants.1 Also, our analysis of the labor force participation rate is only for those of working age broadly defined (16 to 64) or of prime working-age (25 to 54). The elderly are not included in this analysis. The Bureau of Labor Statistics includes the elderly when it reports the labor force participation rate in its monthly employment situation reports. But including the elderly conflates the decline in participation among the working-age with the overall aging of American society.
 |
|
Sources: Figures for 1960, 1970, 1980, and 1990 are from the public-use decennial census, which is collected in April. Figures for 2000, 2006, 2019, and 2023 are from the March, April, and May public-use CPS. In Kansas, the rate remained unchanged from 2000 to 2023, and the District of Columbia is not a state. |
End Note
1 The term “immigrant” has a specific meaning in U.S. immigration law, which is all those inspected and admitted as lawful permanent residents. In this analysis, we use the term “immigrant” in the non-technical sense of the word to mean all those who were not U.S.-citizens at birth. Typically, the government refers to these individuals in surveys such as the CPS or decennial census as the “foreign-born”. While it may surprise some, the Bureau of Labor Statistics (BLS) is clear that illegal immigrants are included in the CPS, and the Census Bureau is equally clear that illegal immigrants are included in the census every 10 years and the surveys it collects for the BLS such as the CPS, though some fraction are missed in the census or in surveys. Although there is some undercount, immigrants, or the foreign-born, in the CPS and decennial census include naturalized citizens, legal permanent residents (green card holders), long-term temporary visitors (e.g. guestworkers) and illegal immigrants.