Download a PDF of this Backgrounder
Steven A. Camarota is the Director of Research and Karen Zeigler is a demographer at the Center for Immigration Studies.

While Florida has been among the states with the most job growth in both the short and long terms, much of the increase has gone to immigrants (legal and illegal). Immigrants accounted for 52 percent of the net increase in employment among the working-age (16 to 65) since 2000, while accounting for only 33 percent of population growth among the working-age. The labor force participation rate of Florida's working-age natives has fallen significantly since 2000 and remains low relative to other states. Despite these long-term trends, both of Florida's senators supported the Gang of Eight bill (S.744), which would have roughly doubled future legal immigration and granted legal status to illegal immigrants.
- Relative to other states, Florida ranked second in the nation in employment growth among 16- to 65-year-olds over the last 14 years, but most of these gains have gone to immigrant workers (legal and illegal).
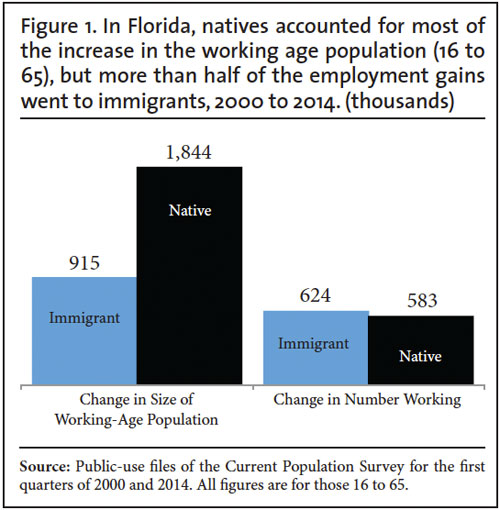
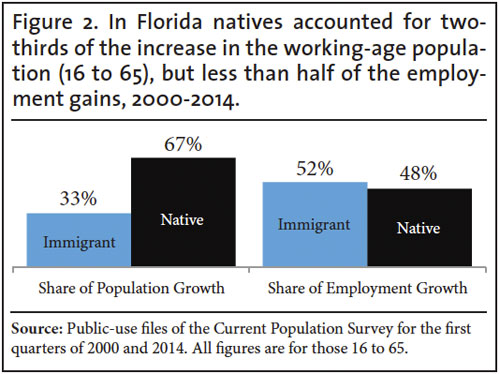
- From the first quarter of 2000 to the first quarter of 2014, 52 percent of the net increase in employment among Florida's working-age (16 to 65) population has gone to immigrants (legal and illegal), even though they accounted for only 33 percent of population growth.
- Since the jobs recovery began in 2010, 64 percent of net employment growth among the state's working-age population has gone to immigrants.
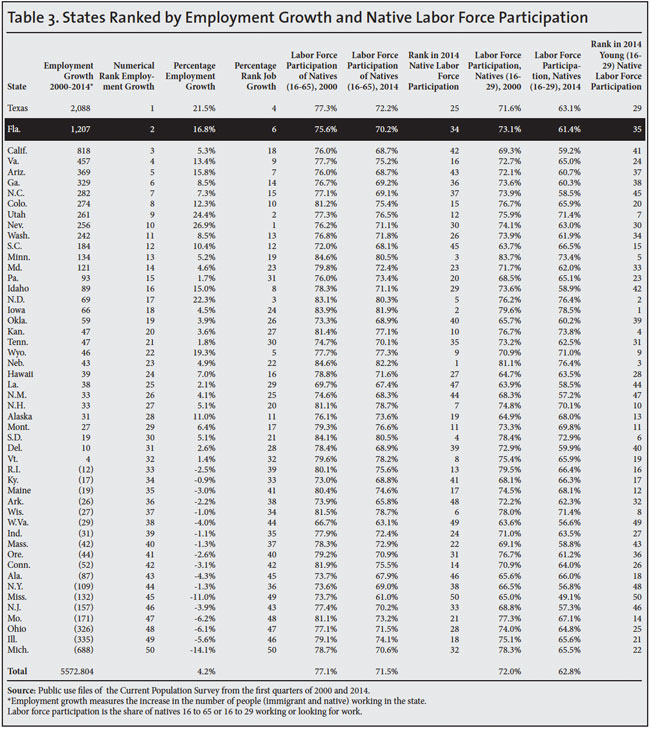
- Even though the state ranked high in employment growth, Florida still ranked 34th in 2014 in terms of the labor force participation of its native-born population (16 to 65).
- Among young natives 16 to 29 years of age, Florida ranked 35th in labor force participation.
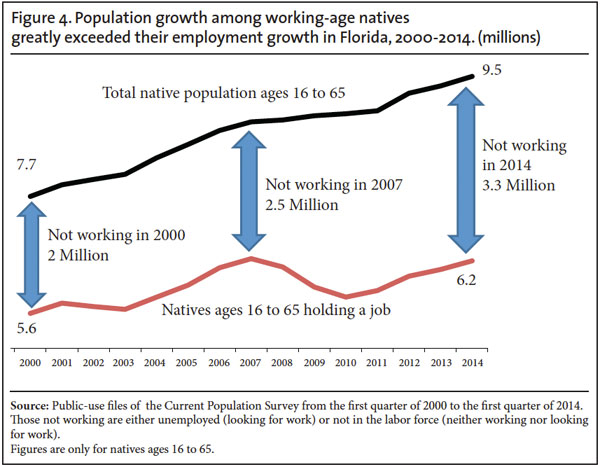
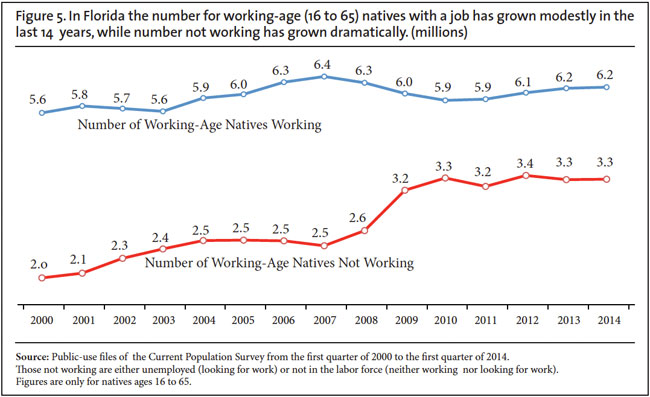
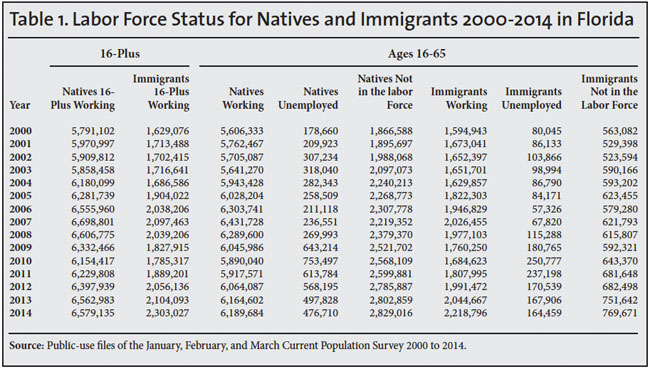
- In 2000, two million working-age natives were not working (unemployed or out of the labor market entirely); by 2014 it was nearly 3.3 million — a 62 percent increase.
- Perhaps most striking, through the first quarter of this year, the labor force participation rate of natives shows no improvement in Florida, even after the jobs recovery began in 2010.
- If the employment rate of natives (16 to 65) in the first quarter of 2014 were what it was in 2000, 768,000 more natives would be working.
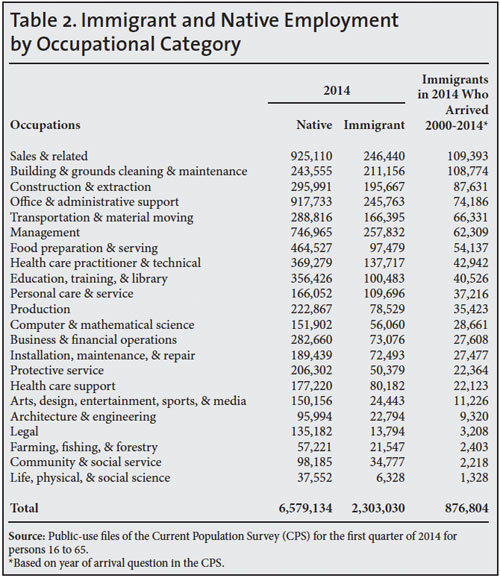
- New immigrants took jobs across Florida's labor market, including lower-skilled jobs such as maintenance and construction, middle-skilled jobs such as sales and office support, and higher-skilled jobs such as management and health care professions.
- While agriculture gets a lot of attention in the state, it employs a tiny share of immigrant workers — less than 1 percent.
- The supply of potential workers in Florida is enormous: half a million native-born college graduates were not working in the first quarter of 2014, as were one million with some college and 1.4 million with no more than a high school education.
- The labor force participation of black, Hispanic, young, and less-educated workers in Florida show the biggest declines
In September 2013, many of Florida's biggest employers including Disney, American Airlines, UPS, and Honeywell, along with a number of other companies, jointly signed a letter to House Speaker John Boehner (R-Ohio) arguing that there are not enough workers in the country — skilled and unskilled. The letter read in part that, "many of our companies continue to have difficulty finding sufficient American workers."1 Both of Florida's senators supported the Gang of Eight bill (S.744), which would roughly double legal immigration as well as grant legal status to illegal immigrants.2 In fact, Republican Sen. Marco Rubio was one of the bill's chief architects. However, the employment picture for Florida's native-born population continues to look bleak.
The number of working-age (16 to 65) natives not working is at or near a record high and their labor force participation is at a record low. The labor force participation of Florida's working-age natives ranks relatively low even through there has been substantial job growth in the state. Much of the job growth in the state has gone to foreign-born workers (legal and illegal). It is difficult to reconcile the enthusiasm of Florida's business and political leaders for increasing the number of foreign workers allowed into the country given the enormous number of natives in the state not working and their generally poor employment situation.
This analysis is based on the "household survey" collected by the government, which does not include those in institutions such as prisons. The survey, officially known as the Current Population Survey (CPS), is the nation's primary source of labor market information.3 Many jobs are created and lost each quarter and many workers change jobs as well. But the number of people employed reflects the net effect of these changes. We focus on the first quarter of each year 2000 to 2014 in this analysis because comparing the same quarter over time controls for seasonality. We also emphasize the economic peaks in 2000 and 2007 as important points of comparison, though we provide data for all years since 2000.
We primarily focus on the labor force participation rate (share working or looking for work) and employment rate (share working) for native-born Americans. Labor force participation and the employment rate are measures of labor force attachment that are less sensitive to the business cycle compared to the often-cited unemployment rate. We use the terms immigrant and foreign-born in this report synonymously. Immigrants or the foreign-born (legal and illegal) are individuals who are not U.S. citizens at birth. Of immigrants in the CPS, about one-fifth in Florida are in the country illegally.
Overall Trends Among the Working-Age
Employment Growth. Comparing the number of immigrants working (ages 16 to 65) in Florida from the first quarter of 2000 to the number working in the first quarter of 2014 shows an increase of 624,000. The number of working-age immigrants employed in the state increased 583,000 over this time period. Thus, total employment growth in the state was 1.2 million, 52 percent of which went to immigrants. The total (immigrant and native) working-age population (working and not working) increased by 2.76 million, with natives accounting for 1.84 million, or 67 percent, of the increase. (See Table 1 and Figures 1 and 2). Thus, working-age natives accounted for two-thirds of population growth among the working-age since 2000, but immigrants received a majority of the net increase in jobs.4
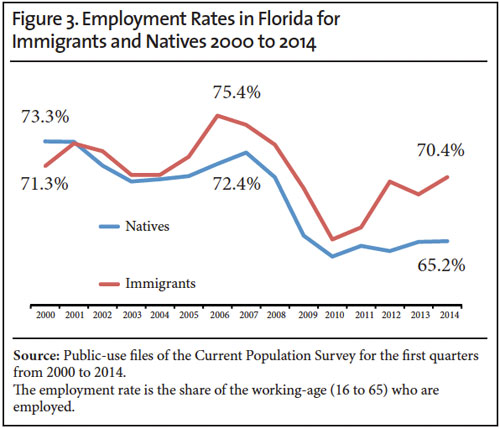
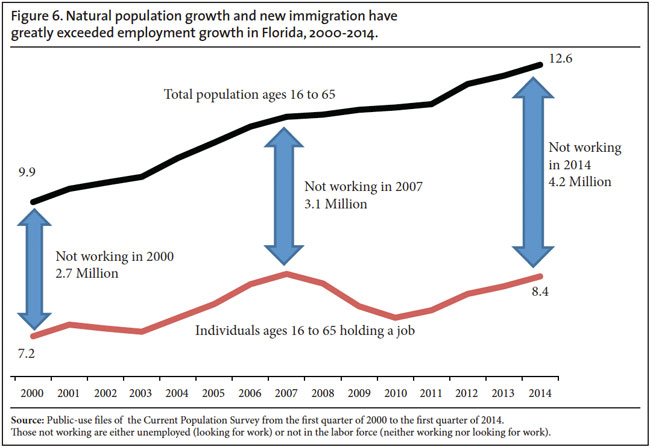
Employment Rate. The 583,000 person growth in the number of working-age natives holding a job represented an increase of 10.4 percent compared to 2000, but the total number of working-age natives increased 24.1 percent. Since the number of working-age natives grew much faster in Florida than the number actually working, the percentage of working-age natives holding a job (the employment rate) declined significantly, from 73.3 percent in 2000 to 65.2 percent in the first quarter of 2014 (Figure 3). We can see how much population growth exceeded employment growth among working-age natives in Figure 4 and Table 1. In 2000, two million working-age natives were not working; by 2014 it was nearly 3.3 million — a 62 percent increase (See Figures 4 and 5). For immigrants, population growth only slightly outpaced employment growth among the working-age over the last 14 years. As a result, the employment rate of immigrants was 71.3 percent in 2000 and 70.4 percent in 2014, a much more modest decline than for natives (See Figure 3). Figure 6 shows how total population growth (immigrant and native) among the working-age in Florida from both natural increase and new immigration since 2000 has greatly exceeded employment growth.
The Jobs Deficit. Of course, not all of the 3.3 million working-age natives not working in Florida (Figure 4) want to work or even can work. But this has always been the case. For this reason it is necessary to look for a trend over time. Both the number and share of natives not working has grown enormously in the last 14 years in Florida. If the employment rate of natives (16 to 65) in the first quarter of 2014 were what it was in 2000 (73.3 percent), 768,000 more natives would be working. If the share working were what it was in the first quarter of 2007 (72.4 percent), 682,000 more natives would have a job today. The situation for immigrants is different. If their employment rate in the first quarter of 2014 were what it was in the first quarter of 2000, just 28,000 more immigrants would be working. Despite being a state were employment grew by 1.2 million jobs, Florida is also a state with a very large job deficit.
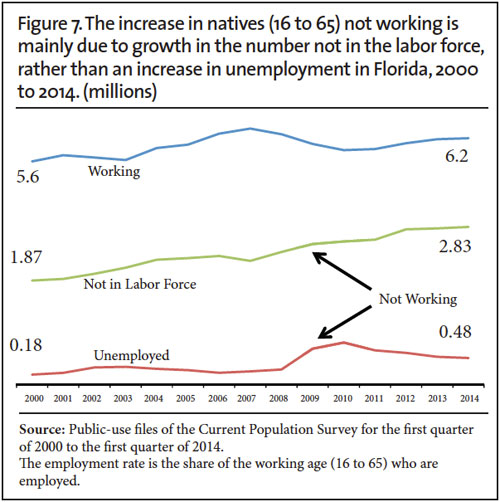
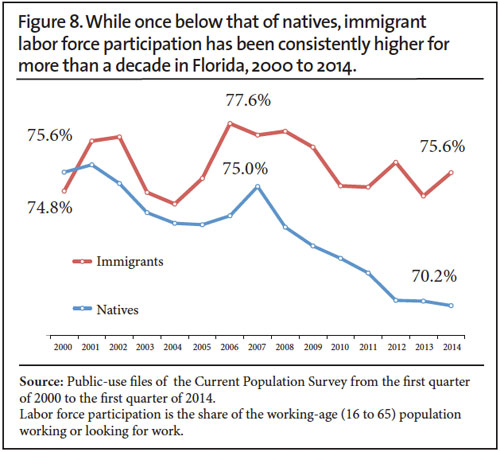
Labor Force Participation. The labor force participation rate is similar to the employment rate except that it is calculated by including the unemployed in the numerator. Thus, to be in the labor market one has to either be working or have looked for a job in the four weeks before the survey was taken. The number of working-age (16 to 65) natives not in the labor market has increased dramatically in Florida, from 1.87 million in 2000 to 2.83 million in the first quarter of 2014. As shown in Figure 7, much of the growth in the number of working-age natives not working was due to a huge increase in the number not in the labor force. The number of natives unemployed also increased, but not nearly as much. Figure 8 reports the labor force participation rate. In 2000, 75.6 percent of working-age natives had a job or were looking for one. By 2014, it was 70.2 percent. Perhaps most shocking, the rate has actually gotten worse for working-age natives in Florida since the jobs recovery began in 2010.
The steady decline in the labor force participation rate in the state means that the decline in unemployment in recent years in Florida is being driven to some extent by an increase in the number of working-age natives leaving the labor market and not by an increase in the number getting a job. We can see this clearly in Table 1, which shows that the number of working-age natives not in the labor force was 261,000 larger in the first quarter of 2014 than it was in the first quarter of 2010. If two-thirds of these individuals were actively looking for work and counted as unemployed, the unemployment rate in Florida would be at least two percentage points higher.
Among working-age natives in Florida, labor force participation is the lowest it has been since the CPS began identifying immigrants and natives separately in 1994. The long-term decline in the labor force participation of working-age natives shown in Figure 8 is profound and troubling. It would seem to be powerful evidence that there is no labor shortage in the state.
The foreign-born in Florida follow a somewhat different pattern than natives. After the 2001 recession, immigrants' labor force participation declined, but then recovered more quickly than natives and was higher at the peak in 2007 than it was for natives. Like the employment rate, the labor force participation rate of working-age immigrants went from being slightly lower than natives in 2000 to be being somewhat higher than natives by 2007. After 2007, the labor force participation rate of working-age immigrants did not decline as profoundly as it did for natives. Moreover, unlike natives in Florida, the labor force participation rate of immigrants has improved somewhat in recent years, though not consistently (Figure 8). Because immigrants have done better than natives over the last 14 years, in the first quarter of 2014, working-age immigrants had a higher labor force participation rate than did natives.
Immigrants Made Job Gains Across the Labor Market
Immigrant Gains by Education. Immigrants tend to be less educated than natives on average and are more concentrated at the bottom end of the labor market in lower-skilled jobs. However, many immigrants are well educated and significant shares are employed in high-skilled professional jobs. Well more than half (60 percent) of the employment gains by immigrants in Florida were for those with at least a bachelor's degree.
Immigrant Gains by Occupation. Turning to occupations, it is unfortunately the case that the occupational categories used by the Census Bureau in the CPS were changed significantly between 2000 and 2014, so direct comparisons by occupation over this time period are difficult. However, Table 2 reports by occupation the number of Florida's immigrants in the first quarter of 2014 who indicated in the survey that they had arrived in 2000 or later. The table shows 877,000 working-age immigrants who arrived in 2000 or later had a job in the first quarter of 2014. This is higher than the net 624,000 increase in immigrant employment shown in Figure 1 and Table 1. The 624,000 figure represents a net increase; the arrival number, on the other hand, represents the flow of new immigrants. New arrivals are offset by deaths, return migration, and those who age out of the 16-65 cohort. Thus, the net increase is substantially less than number of new arrivals.
Both the net increase and the number of new arrivals can be seen as measuring the impact of immigration on the American labor market. In this analysis we emphasize the smaller net increase to be conservative. Table 2 shows that new immigrants found jobs across the labor market, including lower-skilled jobs such as maintenance and construction, middle-skilled jobs such as sales and office support, and higher-skilled jobs such as management and health care professions. So it would be inaccurate to argue that immigrants in Florida only found work at the bottom end of the labor market.
One additional interesting finding in Table 2 concerns farm labor. While farmers and their desire to use immigrant labor play a larger role in the immigration debate, Table 2 shows that less than 1 percent of new immigrants found work in agriculture broadly defined (farming, fishing, and forestry). Two caveats should be added to this number: First, agricultural employment tends to be low in the first quarter of any year, and second, the CPS is not the best survey to measure such a small part of the labor force. Nonetheless, it is a reminder that only a tiny fraction of immigrants work in agriculture in Florida. Other research has shown the same thing nationally.5
Comparison with Other States
As our prior research has shown, Florida is certainly not alone in experiencing large increases in the number of people not working and declines in its employment and labor force participation rates.6 Table 3 compares Florida to other states. In terms of the numerical increase in people working in the state from 2000 to 2014, Florida ranked second in the nation. In terms of the percentage increase in working-age people holding a job it ranked 6th in the nation. Even though the state ranked high in employment growth, Florida still ranked 34th in 2014 in terms of the labor force participation of its native-born population (16 to 65) in 2014. Among young natives 16 to 29 years of age, Florida ranked 35th in labor force participation. Of course Florida did not rank high in native labor force participation in 2000 either. But it is still striking that a state with very significant job growth over the last 14 years both numerically and proportionately still saw a significant decline in native labor force participation and continues to rank relatively low in labor force participation.
Young Workers in Florida
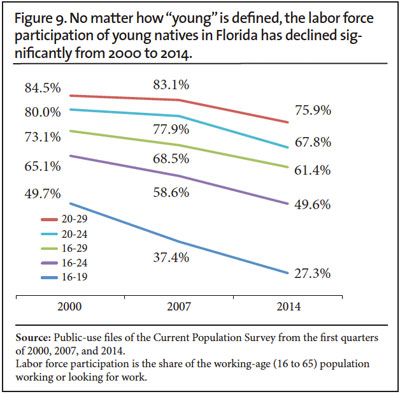
Native Labor Force Participation. The decline in labor force participation in Florida among natives has been more pronounced among the young. Figure 9 shows the decline in labor force participation among Florida's native-born population under age 30 over the last 14 years. One important thing to notice about the figures is that the labor force participation rate of Florida's young natives was lower at the peak in 2007 than in 2000. When employment peaked in 2007, the share of young natives in the labor force never made it back to the 2000 level. This is true of teenagers, those 16 to 24, and those in their 20s. The labor force participation rate for all natives 16 to 29 in the state was 68.5 percent in the first quarter of 2007, compared to 73.1 percent in 2000. In the first quarter of this year it was an abysmal 61.4 percent — 11.6 percentage points below the level in 2000. Thus, the decline in labor force participation among younger natives in Florida is both profound and long-term. Along with the decline in percentage in the labor force, the number of young natives not in the labor force has increased dramatically as well. For natives 16 to 29, the number not in the labor force increased by 460,000 between 2000 and 2014.
Young Immigrants. The labor force participation rate of younger immigrants also declined, especially for immigrant teenagers. One might think that younger immigrants have higher rates of labor force participation or higher employment rates. But this is not really the case in Florida or the nation. In the first quarter of 2014, 27.3 percent of native-born teenagers were in the labor force in the state compared to 22.7 percent of teenage immigrants. For natives 20 to 29 in 2014, 75.9 percent were in the labor force, virtually identical to the 75.8 percent of immigrants in their 20s. Looking at all those under age 30 in the state shows that natives had a higher rate of labor force participation than immigrants, though the difference has narrowed significantly over the last 14 years. Some observers argue that American youth have a work ethic problem and this explains why such a large share employment growth has gone to immigrants. However, at least relative to immigrants in Florida, the data do not support this argument.7 Or put at different way, if there is a work ethic problem with American's youth, it is as pronounced among immigrants as it is among natives.
Education and Race
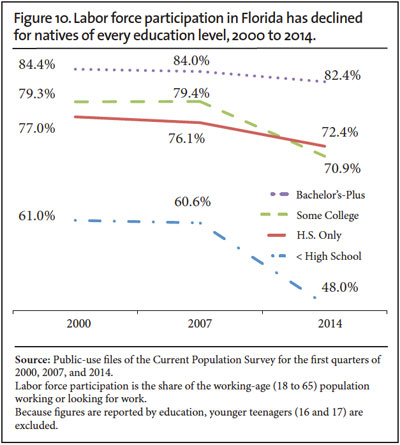
Education Level. The decline in the labor force participation rate for natives has impacted those of every education level. Figure 10 shows the share of natives with at least a bachelor's degree, some college, a high education, or less than high school education who are in the labor force.8 Labor force participation is lower now than it was in 2007 or 2000 for every educational group. Natives in Florida with less than a high school education and only a high school education show the biggest declines. In fact, for those two groups, the decline began before the Great Recession in 2007. The growth in the share of natives not working for every education group has been very large. The supply of potential workers in Florida is therefore enormous. In the first quarter of this year, more than half a million native college graduates were not working, as were one million with some college and 1.4 million with no more than a high school education. There were also 460,000 immigrants with at least some college not working and 460,000 immigrants with a high school education or less not working, more than at the start of 2014. Given these numbers it is puzzling why some of Florida's largest businesses argue there are not enough workers in the state.
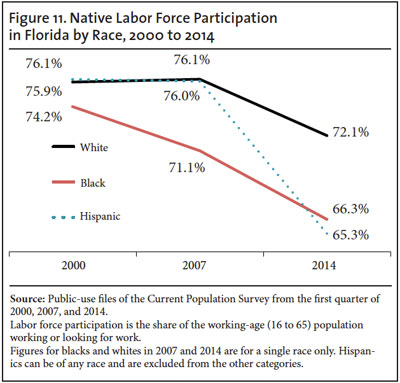
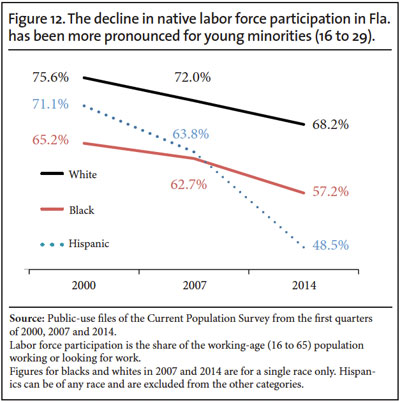
Labor Force Participation by Race. Figure 11 shows the decline in labor force participation for native-born whites, blacks, and Hispanics in Florida. Labor force participation for black working-age natives was declining even before the 2007 downturn, but the situation for whites and Hispanics was somewhat different. It was after 2007 that their labor force participation fell dramatically and it has not come close to recovering. Figure 12 reports labor force participation for younger (16 to 29) natives in Florida by race. The figure shows a significant decline for all three groups from 2000 to 2007 and then a very large decline after 2007. Young Hispanic natives in the state under age 30 have been especially hard hit. As recently as 2000, more than 71 percent had a job; in the first quarter of this year fewer than half worked.
Conclusion
While Florida has been among the states with the most job growth, much of the increase has gone to immigrant workers — legal and illegal. Since 2000, more than half of the net increase in employment among the working age (16 to 65) has gone to immigrants, even though they accounted for only one-third of population growth among the working-age. Relative to other states, Florida ranked second in the nation in the increase in the number of 16 to 65 year olds holding a job, but ranked 34th in terms of the labor force participation of its native-born population in 2014. Perhaps most troubling, the labor force participation of Florida's working-age natives shows no improvement, even after the jobs recovery began in 2010. The total number of working-age natives (16 to 65) not working (unemployed or out of the labor market entirely) has increased 62 percent since 2000, and stood at 3.3 million in the first quarter of this year. Immigrants, on the other hand, have fared better; their labor force participation is higher now than in 2000 and has nearly returned to its 2007 level.
Despite what can only be described as a bleak employment picture for natives in the state, many of Florida's biggest employers have lobbied for increases in the number of foreign workers, both skilled and unskilled, allowed into the country. Both of Florida's senators supported the Gang of Eight bill (S.744), which would have roughly doubled future legal immigration, on the grounds that there are not enough workers in the country. But employment data for the state do not support the idea that workers are in short supply. In fact, the available evidence indicates that there is an enormous supply of potential workers of every education level in the state. While the Gang of Eight bill is now considered politically dead by all observers, in the future Florida's political leaders should at least consider the employment situation in their state before supporting calls for significantly increasing the number of foreign workers allowed into the country.
End Notes
1 See this 2013 letter to Congress from Florida businesses.
2 "S. 744 Border Security, Economic Opportunity and Immigration Modernization Act", Congressional Budget Office cost estimate. Table 2, p. 14 reported that by 2023 there would be 10.4 million additional U.S. residents had the bill passed, 1.2 million of whom would be the U.S.-born children of these new immigrants. The remainder will have been new immigrants living in the country if the bill had become law.
3 We do not use the "establishment survey", which measures employment by asking businesses, because that survey is not available to the public for analysis. Equally important, it does not ask if an employee is an immigrant. The CPS does not include those in institutions such as prisons.
4 Table 1 reports employment for working-age (16 to 65) immigrants and natives for every quarter since 2000. It also reports the number of people working who are 16 or older. Comparing the first quarter of 2000 to the same quarter in 2014 shows that, among the working-age in Florida, 52 percent of employment growth has gone to immigrants. However, looking at all workers 16-plus, not just those under age 65, shows that natives over age 65 also made employment gains of 205,000. There were also 50,000 additional immigrants working in the first quarter of 2014 when those over age 65 are counted. We focus on those 16 to 65 because 95 percent of all workers in the state are under age 65, and when considering employment rates or labor force participation it is necessary to limit the analysis by age as the vast majority of those over age 65 do not work now nor have they done so historically. Limiting analysis by age is always also necessary to compare employment growth to population growth.
5 In a more detailed analysis by occupation using the much larger American Community Survey (which measures employment year-round), we found that about 2 percent of immigrant workers nationally from 2008 to 2011 were employed in agriculture. See "Are There Really Jobs Americans Won't Do? A detailed look at immigrant and native employment across occupations", Center for Immigration Studies, 2013.
6 "All Employment Growth Since 2000 Went to Immigrants: Number of U.S.-born not working grew by 17 million", Center for Immigration Studies, 2014.
7 In prior research we have found the same thing at the national level. See p. 12 of "All Employment Growth Since 2000 Went to Immigrants: Number of U.S.-born not working grew by 17 million", Center for Immigration Studies, 2014.
8 Education levels are for those 18 to 65, and not 16 to 65 as elsewhere in this report, because we wish to exclude younger teenagers 16 and 17 who are typically still in high school.