Introduction
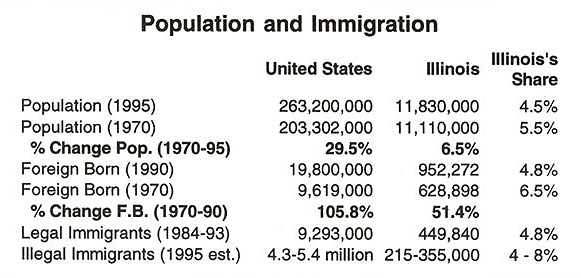
Illinois is now the sixth largest state in the nation and has the sixth largest foreign-born population, according to the Census Bureau. In 1980, it ranked fifth in both categories. Numerically, Illinois' population barely grew between 1980 and 1990-from 11,426,518to 11,430,602 -but the foreign-born share of the population increased from 7.2 percent to 8.3 percent. Its mid-1995 population was 11,830,000, indicating that the growth rate is increasing. But population growth, per se, is not an issue that concerns the people of the state, as it does in places like Florida and California. Indeed, some Illinoisans are worried that the state is not growing fast enough. But could that worry be misplaced? Has Illinois grown to the point where it should consider the advantages of a no-growth policy, or can its carrying capacity comfortably accommodate additional millions of people in the future? This paper addresses that question, and calls on Illinoisans to consider where the state is headed.
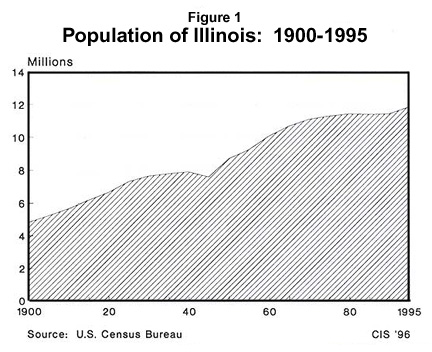
The state has not grown much for some decades. Its 1960 population was just over ten million, compared to 11.4 million in 1990 (see Figure 1). However, it is important to bear in mind that, in reality, Illinois is a state that has long been divided within itself. Over half of all Illinoisans reside in the Chicago metropolitan area, with the remainder spread out through the rest of the state. "When the 'down-stater' visits Chicago...he travels in and out of the city by train or expressway, rarely seeing deeply into the city and the problems behind its swift-paced, modern facade. When the Chicagoan seeks a relaxing weekend, he is most likely to drive to Wisconsin or Michigan, thus never developing a feeling for the 'other Illinois.'"1 In this study, while we will look at the state as a whole, considerable attention will be given to the Chicago area in particular.
The components of population growth are fertility, mortality and migration. This study is focused primarily on migration. Migration out of Illinois to other states has been increasing in recent years, contributing to the low population growth rate. More important, however, is immigration and how it is contributing to changes in Illinois's — not only Chicago's — population and what the prospects are for the future, if these trends continue. While native-born Illinoisans are moving out of the state, they are being replaced by immigrants from other countries. Thus, the demographic challenge for Illinois is not growth, but rather changing composition and the wide disparity between Chicago and the "other Illinois."
Population numbers are not easy to grasp, especially when the U.S. population now exceeds a quarter of a billion people. The population concentration varies greatly among different regions. States like Nevada support slightly over ten persons per square mile. On the other extreme, New Jersey has over 1,000 per square mile. Illinois has 206 persons per square mile. The greatest national population increases are occurring in the West and the South, with immigration playing a major role in many of the states in these regions. Recent evidence suggests that this role is expanding into neighboring states, as well. The Census Bureau now projects a U.S. population of about 400 million by the middle of the next century — more than 50 percent larger than today. Whether this projection becomes reality will depend on actions we take now to shape our future.
This study looks first national demographic trends and then at those in Illinois. The discussion is divided into past and present conditions and future trends. It is intended to be indicative — not exhaustive — of relevant issues that must be considered as Illinoisans decide the future they wish for their posterity.
National Population Change and Immigration
Immigration is widely recognized as a major factor in the population growth of California, Texas and Florida, but it also plays an important role in the growth of many other states, including Illinois. Yet, since immigration is a federal responsibility, states are limited in their options and must look primarily to the federal government to act when their interests are at stake. For that reason, we begin this report by looking at the present national context, at what it was 25 years ago, and then at what could happen in the next 25 years.
The Present: At mid-decade, the nation's population has reached about 263 million. Since the 1990 census, we have increased by 14 million people. For the five-year period beginning July 1, 1990 and ending June 30, 1995, about nine million people have been added through natural increase (i.e., births minus deaths) and another five million through net international migration (i.e., immigrants minus emigrants). No records are kept on how many leave the country permanently nor on how many enter illegally. It is generally agreed, however, that between 160,000 and 250,000 leave every year, while more than 300,000 enter the country clandestinely or fail to depart at the end of a temporary stay. As a result, net immigration, whether legal or illegal, accounts directly for at least one-third of recent population growth.
The Recent Past (1970-1995)
Over the past quarter of a century the U.S. population has increased at a rate higher than that of any other industrialized nation. At the 1970 census, 203 million people were enumerated. That number had surpassed 249 million by 1990. By 1995, 60 million people had been added to the nation's population in just 25 years. This represents an annual average rate of growth over 1.1 percent per year. If that rate is maintained, the population will double in less than 65 years.
Immigration has been a major factor in this rapid growth. According to a recent study by the Urban Institute, if immigration had come to an end in 1970, the 1990 population of the United States would have been 229 million rather than 249 million. Thus, immigration, directly and indirectly, accounted for 44 percent of all growth over those two decades. A 1995 estimate by the Center for Immigration Studies puts the current share of population growth due to immigrants and their U.S.-born children at just over 50 percent.
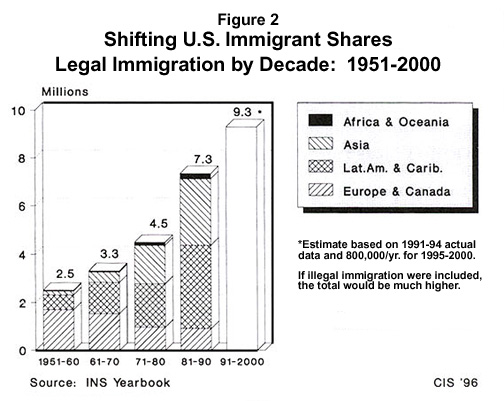
During the 1970s, legal immigration amounted to 4.5 million. It rose to 7.3 million during the 1980s. If current rates continue, it will exceed nine million during this decade (see Figure 2). Because of this escalating immigration, we estimate that the foreign-born population reached 24 million (9.1% of the population) in 1995, and, unless immigration levels are reduced, it likely will exceed ten percent at the turn of the century.
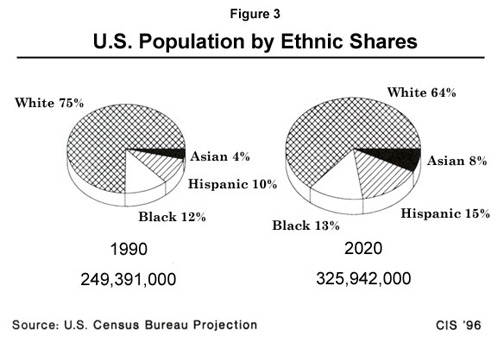
As a result of both the substantial increase in immigration and the changing sources of that influx, the ethnic composition of the United States has changed dramatically since 1970. Then, non-Hispanic Whites (hereinafter simply Whites) comprised 85 percent of the nation's population. Now, that share is down to less than 75 percent. The Black proportion has remained more stable, increasing from ten to 12 percent. In contrast, the Hispanic share has doubled from five to ten percent and Asians (along with Native Americans and Pacific Islanders) have seen the fastest rate of growth, rising from less than one percent in 1970 to almost four percent today.
The Near-Term Future (1995-2020): According to the Census Bureau's current medium projection, the population will reach 275 million in 2000, 298 million in 2010 and 323 million in 2020. If both fertility and immigration remain at current levels, some 70 percent of the growth between 1995 and 2020 will be attributable to immigration, whether directly by the newcomers or indirectly by their U.S.-born children. Thus, immigration clearly is the prime factor that will shape future population growth in the United States.
Current immigration levels will produce further rapid change in the nation's ethnic composition. The Census Bureau projects that, by the turn of the century, the proportion of Whites will have shrunk to 71.5 percent, Blacks will have held their share at 12.3 percent, and Hispanics and Asians will have grown to 11.1 percent and 5.1 percent, respectively. This trend will continue indefinitely. By 2020, the projected shares will be: Whites 63.9; Blacks 13.3; Hispanics 15.2 — making them the nation's largest minority; and Asians 7.6 (see Figure 3). The nation will be unalterably on its way to becoming a "non-majority" society, i.e., one with no single group in the majority. Current trends in fertility and immigration will produce that result shortly after 2050.
Such rapid growth and change in the ethnic composition of the population pose an enormous challenge for the society. Over the past 25 years, the nation has added 60 million people. Given current problems, such as water shortages, the accumulation of wastes, persistent poverty and recurring cycles of unemployment, can we realistically accommodate another 60 million people over the next 25 years and another 75 million in the following 30 years? Indeed, it is argued by a growing number of scientists that we are already overpopulated.
Although the momentum built into population change precludes any near-term end to this expansion, this does not mean that the issue should be ignored. The conditions that will confront future generations will be shaped by decisions made today. Fertility might decline from its present average rate of 2.0 births per woman to 1.7 by 2000 and then gradually to 1.6 by 2020, but this, by itself, would not stop the population surge. That change plus lower immigration — to about 200-250,000 annually — would still result in a population of almost 300 million by 2020. This would be a large increase to accommodate, but some 25 million fewer than if nothing changed. Beyond that date, however, a leveling of population size would begin to take hold.
These are issues that will affect every American and every immigrant to our shores. But, depending on where they live in the United States, many are already feeling the pinch, while it will creep up more gradually on others. In the states most affected by immigration, there are already efforts underway to influence the future course of events without waiting for Washington to act.
Immigration Growth in Illinois
The population changes in Illinois in the recent past and those projected for the near future are not similar to those in the United States in general. While immigration to Illinois has increased dramatically in recent years, most immigrants arriving during the 1980s settled in the Chicago area. In this section, we will examine the current, past and future demographic situation in Illinois, in the context of certain social and economic variables that are especially susceptible to changes in immigration and the number of foreign born in the population. What is the contribution of immigration to population change? And what does this mean for the state?
Current Conditions
At mid-decade, the population of Illinois is just under 12 million. At the 1990 census, 11,430,602 Illinoisans were enumerated, including 952,272 foreign-born residents. From 1990 through 1994, about 250,000 legal immigrants settled in Illinois In addition, the number of illegal residents in Illinois is estimated at between 215,000 and 355,000. Thus, immigration is a major contributor to population growth in the state, and illegal immigrants may comprise as much as 30 percent of the state's foreign-born population, most of which resides in the Chicago area.
More people leave Illinois and move to other states than enter from other states. Between 1985 and 1990, while 667,778 people moved to Illinois from another state, just under one million moved from Illinois to another state.2 Over the same period, almost 200,000 people moved into Illinois from abroad. Thus, the population challenge facing Illinois is not growth; it is composition. For example, according to studies by demographer William Frey of the University of Michigan, between 1985 and 1990, almost three-quarters of the net out-migration of 320,331 were non-Hispanic Whites; of the 195,654 immigrants who came to Illinois, over two-thirds were minorities.3
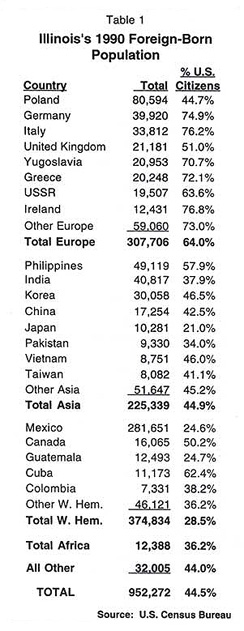
According to the 1990 census, 74.8 percent of Illinoisans were White, 14.6 percent were Black, 8.0 percent were Hispanic and 2.6 percent were Asian or Other (i.e., including Native Americans and Others). Of the 952,272 foreign born residing in Illinois in 1990, Mexico was by far the leading country of birth, accounting for 281,651 people- almost 30 percent of all the foreign born living in Illinois. Other leading sources included Poland (80,594), the Philippines (49,119), India (40,817), Germany (39,920), Italy (33,812) and Korea (30,058).
Only 44.5 percent of Illinois's foreign-born population had become U.S. citizens by 1990. Among the leading countries of origin, the proportion of U.S. citizens varied from 74.9 percent for persons born in Germany to 24.6 percent for persons born in Mexico. This low rate is partially explained by the five-year residence requirement for naturalization. However, other evidence has shown that immigrants from Latin American countries are less likely to become naturalized than their counterparts from Europe and Asia (see Table 1).
Since 1990, immigrants have continued to come primarily from Poland, Mexico, Central America and Asia, especially India and Korea. By mid-1995, the share of Whites and Blacks had perhaps fallen slightly as the share of Hispanics and Asians continued to grow. For example, in 1993 alone, 8,911 immigrants came from Mexico and 3,991 came from India. On the other hand, 10,651 —most of whom were beneficiaries of the visa lottery program created by the 1990 Immigration Act — came from Poland.
Given Illinois' s growing foreign-born population, it should not be surprising that 14.2 percent of the state's residents age five or over do not speak English at home. Almost 700,000 Illinois residents either speak no English or do so very poorly. Undoubtedly the number of Illinoisans not literate in English is growing.
The 1990 census identified 4,197,720 Illinois households — 55.3 percent of which were traditional husband-wife (with or without children) families. That proportion is greater among Hispanics and Asians (72.5% and 68.9%) than among Whites (58.4% ) and Blacks (31.7%). Family size averaged 3.26 persons. It was lower among Whites (3.08) but higher among all other groups: Asians 3.72; Blacks 3.62; and Hispanics 4.06.
Median family income was $38,664 and per capita income was $15,201 in 1990. Nine percent of families had incomes below the poverty level. Income variations by ethnicity were substantial. Whites, Asians, Blacks and Hispanics had median family incomes of $41,457, $43,365, $24,388 and $28,780, respectively. While only 5.5 percent of White families had incomes under the poverty level, the share for Blacks was 27.6 percent, for Hispanics 17.8 percent and for Asians 9.3 percent.
Almost half (46.2 percent) of all residents age 25 or over had at least some college education. However, that proportion varies considerably by category: Whites 48.2; Hispanics 24.5; Blacks 39.3; and Asians 69.8 percent. At the other extreme, 2.1 percent of all adults had less than five years of school. That share was 1.1 among Whites, 3.0 among Blacks, 4.4 among Asians and 13.6 percent among Hispanics.
Illinois stands at about the national average when examining health related statistics. The state's infant mortality rate is 11.3 per 1,000 births, compared to 10.0 per 1,000 for the nation. In 1993, there were 40.3 new AIDS cases per 100,000 Illinoisans, compared to a rate of 40.1 per 100,000 nationally. There are 216 physicians per 100,000 Illinoisans, compared to 214 per 100,000 nationwide.
The Recent Past (1970-1995)
As noted earlier, the population of Illinois grew by a mere 4,000 during the 1980s. In the 1970s, the state increased by less than three percent -from 11,110,285 to 11,426,518 in 1980. Thus, in 25 years — 1970-1995 — the population increased by just over 700,000 people.
While the state's population has grown through natural increase (i.e., more births than deaths ), it has lost population through continued negative net migration — more people leave the state than enter it. Earlier we cited the figures for 1985-1990, but this pattern has been present for some decades.
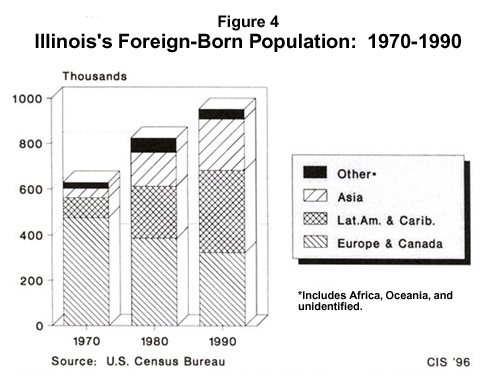
On the other hand, the contribution of recent immigration to the population of Illinois has been significant. Between 1970 and 1990, possibly as many as one million immigrants settled in the state. Legal immigration averaged around 40,000 annually throughout the 1980s. Illegal immigration was also a factor — about 160,000 illegal aliens in Illinois applied for the 1986 amnesty. As a result, the foreign-born population of the state has increased by over 50 percent — from 628,898 in 1970 to 823,696 in 1980 and 952,272 in 1990 (see Figure 4). According to recent Census data, the number of foreign born in Illinois has just passed the million mark.4
The source of this immigration has also shifted in recent decades. In 1970, the Mexican-born population of Illinois numbered about 50,000, while over 72,000 of the state's foreign born were from Poland and more than 68,000 were from Germany. Other leading countries of origin included Italy (60,243), the United Kingdom (29,718), USSR (29,590) and Canada (21,875). Only about 40,000 of the foreign born were from Asia. Just 25 years ago, it is apparent that Illinois had many more "old wave" immigrants than "new wave" ones.
This pattern changed significantly during the 1970s as a result of the 1965 Immigration Act. By 1980, Mexico was by far the leading source country with 167,924 residents. There were 64,293 immigrants from Poland, 54,725 from Germany, 48,866 from Italy and 34,299 from the Philippines. In addition, 146,649 Asian-born immigrants were counted in the 1980 census.
This trend accelerated during the 1980s. The number of European-born residents fell to 307,706 in 1990 from 366,238 in 1980. But the Asian-born population soared to 225,339. By 1990, foreign-born Filipinos had increased to 49,119, Indians to 40,817 (23,373 in 1980) and Koreans to 30,058 (19,383 in 1980). But it was the growth of the Mexican-born population that was most notable. It totaled 281,651 — almost 3½ times Poland's 80,594 — and was by far the largest foreign-born contingent in the state.
The share of the total population of the state that is foreign born rose from 7.2 percent to 8.3 percent between 1980 and 1990. This new immigration - overwhelmingly from Latin America and Asia along with the departure of native-born Whites, has contributed to significant shifts in the ethnic composition of Illinois. Since 1970, the state has become increasingly diverse in its racial composition. The Hispanic population (both native and foreign born) grew from 393,000 in 1970 to 904,000 in 1990. Its share of the population increased from 3.5 percent in 1970 to 8.0 percent in 1990 and is even higher today.
From an insignificant 80,000 in 1970, the Asian (including Others) population grew to 302,000 in 1990. Together with the Native Americans they comprised 2.6 percent of the state's 1990 population. While Mexicans dominate the Hispanic population of Illinois, no single group predominates in the Asian population — Koreans, Indians, Filipinos and Chinese are all well represented.
Blacks have continued to increase their numbers over the years, from just under 1.4 million in 1970 to almost 1.7 million in 1990. Despite the decrease in the number of Whites, however, the Black share of the population has remained quite stable at around 14 percent, in large part because of the rapid increase in the number of other minorities.
The White share of the state's population dropped from 83.2 percent in 1970 to 78.0 in 1980 and 74.8 in 1990. It is probably close to 70 percent today. Numerically, there were 700,000 more Whites residing in Illinois in 1970 than in 1990. Thus, while all minority groups saw their numbers and shares rise, the majority fell both in percent and in numbers.
Regional Impact
Regions of the state are affected differently by immigration. Chicago, being the state's largest city and a major business and transportation hub, has attracted most immigrants. In this section, we will concentrate on the city, as well as its metropolitan area, to illustrate how immigration can have a major impact on a city in just a few years. As was mentioned in the introduction, Illinois is composed of two distinctly different parts. After discussing the Chicago area, we will look briefly downstate, at the "other Illinois" to show the vast demographic differences between the two parts.
Chicago
Chicago city's population in 1990 was 2,783,726. It is the third largest city in the nation. Since 1970, however, Chicago has seen its population decline substantially. In 1970, the city's population stood at 3.3 million. By 1980, it had fallen to just over three million, and was perhaps closer to 2.8 million in 1995. Somewhat surprisingly, the Chicago Primary Metropolitan Statistical Area (PMSA) was one of the few in the nation to lose population over that 20-year period.5 It numbered 6,003,287 in 1970, 6,060,383 in 1980 and 6,069,974 in 1990.
Over the 1970-1990 period, the city's foreign-born population increased by more than 25 percent, making up for the movements out of the city of long-time residents. By 1990, there were 469,187 immigrants living in the city of Chicago — 17 percent of the city's total population. Thus, of the entire 1990 foreign-born population of Illinois, about half lived in the city of Chicago and almost as many lived in its suburbs. Close to 80 percent of foreign-born Illinoisans reside in the Chicago area. This rising number of immigrants, along with an exodus by native-born Whites and some Blacks, has contributed to major shifts in the ethnic composition of Chicago and its suburbs.
In 1995, the Chicago-based Latino Institute released a report, based on 1990 census data, on immigrants in the nine-county area that comprises the Illinois part of the Chicago CMSA (i.e., excluding adjacent counties in Indiana and Wisconsin). The study found that immigrants are over-represented in low-wage, low-skil1 jobs: almost half of all groundskeepers, gardeners, hand packers and machine operators and over one-third of all maids, cooks and cabdrivers in the area were immigrants. The study also found that immigrant workers, on average, earn 20 percent less than native-born workers. What impact does this abundance of low-skill, low-wage foreign workers have on the local economy? According to Barry Chiswick, head of the economics department at the University of Illinois at Chicago, "The economy can absorb more low-income workers, no question about it, but the price is depressing wages and limiting job opportunities for U.S.-born low-income workers."6
Chicago City
In 1970, Whites comprised 58.2 percent of the population of the city of Chicago, Blacks 32.7 percent, Hispanics 7.4 percent and Asians and Others 1.7 percent. The White share fell to 43.2 percent in 1980; the Black share rose to 39.6 percent; that of Hispanics almost doubled to 14.0 percent; and Asians and Others rose to 3.2 percent. By 1990, Whites had become the "second" minority, with their share down to 37.9 percent, and Blacks comprised 38.6 percent of the city's population. The Hispanic share had risen to over 19 percent and Asians and Others made up 3.9 percent of the population. By 1995, the White share was probably approaching 35 percent.
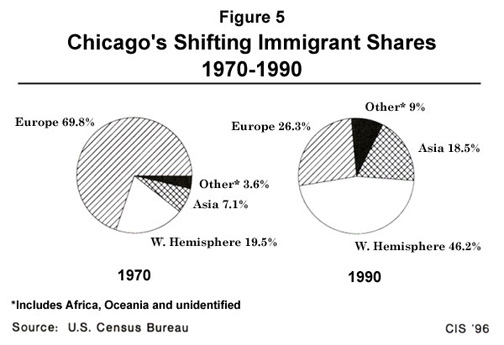
Looking solely at the foreign-born population of the city of Chicago illustrates the enormous ethnic shifts that have taken place since 1970. In 1970, the city's 373,919 foreign-born residents made up 11.1 percent of its population. Seven out of ten immigrants were of European birth. Two out of ten were from North or South America.7 By 1980, the proportions had shifted dramatically. European-born residents dropped to 38.4 percent, Asians rose to 15.4 percent and North and South Americans rose to 37.7 percent. The European-born share fell to 26.3 percent in 1990, while that from Asia rose to 18.5 percent and that from the Americas rose to 46.2 percent (see Figure 5).
The Mexican-born population of Chicago rose from 38,771 in 1970 to 174,709 in 1990, Filipinos increased from 7,841 to 22,851 and Koreans surged from 1,333 to 11,267. The same trend holds true for other Hispanic and Asian nationalities, as well, explaining how Chicago has seen its ethnic character change over that 20-year period.
These ethnic shifts have had a particularly strong effect on the city's public school system. Transitional bilingual education programs are implemented in 19 languages. Students speaking more than 70 additional languages are enrolled in other transitional programs of language instruction.8 Over the past dozen years the number of LEP (limited English proficiency) students in the city has doubled. Currently, about 63,000 LEP students are enrolled in the public schools of Chicago, which currently spends about $60 million a year to cover its portion of these programs.
Chicago PMSA
Between 1985 and 1990, the Chicago area lost 191,483 Whites and 69,593 Blacks. During the same period, 44,823 Asian and 72,719 Hispanic immigrants moved to the area.9 The metropolitan population by 1990 was 62.3 percent White, 21.7 percent Black, 12.1 percent Hispanic and 3.9 percent Asian and Others. Today, it is estimated that Mexicans account for 40 percent of the almost 800,000 immigrants in the Chicago PMSA. Other leading foreign-born groups included those from the Philippines, Poland, India, Germany, Italy and Korea.
The White share of the Chicago PMSA has fallen gradually since 1970. Then, Whites comprised 76.7 percent of the area's population; by 1980 it was down to 69.3 percent; and in 1990, as noted, it stood at 62.3 percent. Minority groups, on the other hand, increased their share and numbers over that 20-year period.
However, it should be pointed out that the suburbs — excluding Chicago city — remain predominantly White. In 1990, for example, over 80 percent of all Blacks in the PMSA resided in the city proper. In contrast, only 17 percent of the PMSA's Whites lived in the city, with the balance living in the suburbs. Nevertheless, it is clear that the overall metropolitan area is becoming increasingly diverse, as minorities move to the suburbs and are replaced in the central city by new immigrants. Indeed, 22 suburban municipalities have a higher percentage of immigrants than the city of Chicago.
The "Other" Illinois
Looking at lllinois minus the Chicago PMSA yields an entirely different demographic picture. Its 1990 population of 5,360,628 represents almost 47 percent of the state's total. Almost 89 percent of downstate residents are White, 6.7 percent are Black, 3.2 percent are Hispanic and 1.2 percent are Asian and Other. The data for 1980 and 1970 reflect a similar picture but with fewer minorities in the population. Thus, there are indeed "two Illinois." And that may be one of the more pressing demographically-fueled problems facing the state: ensuring that the two parts continue working effectively together, while the Chicago area becomes more and more diverse and the balance of the state remains overwhelmingly White.
Counties
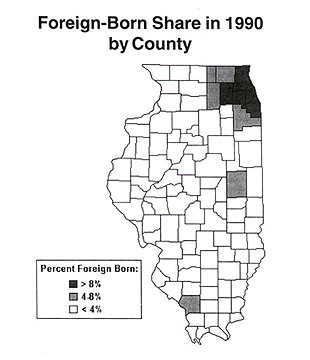
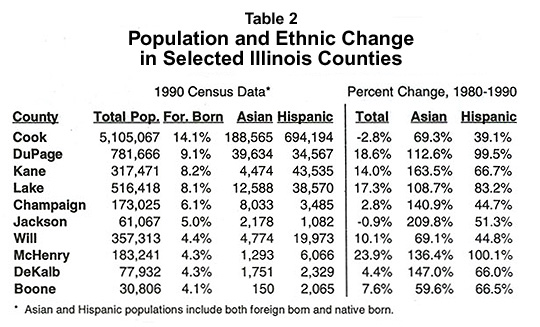
We have noted that the vast majority of Illinois's foreign-born population lives in the Chicago area, located in the northeast corner of the state. Table 2 lists the ten counties in Illinois with foreign-born concentrations of four percent or more. All but two of these counties — Champaign and Jackson —a re in the Chicago area, as the state map on the following page illustrates. The foreign-born concentrations in both Champaign and Jackson are explained in large part by the presence of state universities — the University of Illinois, Urbana-Champaign in Champaign County and Southern Illinois University in Jackson County until about 20 years ago also had a coalmining industry which attracted significant numbers of Eastern European immigrants, many of whom may still live in the area.
The data in Table 2 show that the overall populations of these counties are growing ( or declining in the cases of Cook and Jackson Counties) at disparate, but relatively low, rates. In each county, however, the Asian and Hispanic populations, driven by immigration, are increasing rapidly, with rates of change well above the rates for the total county populations. Even in Cook and Jackson Counties, where the overall population is declining, there is significant growth in the Asian and Hispanic populations. The data reflected in this table once again point out the dramatic changes in ethnic composition that are occurring in parts of Illinois.
The Next 25 Years (1995-2020)
According to the most recent projections prepared by the Census Bureau, Illinois's population likely will approach 12.2 million by the turn of the century and 13.2 million 20 years later. Between 1990 and 2020, Illinois is projected to be one of the slower growing states in the nation. Thus, Illinois may be spared the rapid-growth problems facing states like Florida and California. However, it will have a continuing, and growing, challenge as its racial composition continues to shift, as the native born move out and are replaced by immigrants, and as the differences between the Chicago area and downstate are exacerbated.
A more detailed examination of the Census Bureau projection suggests that between 1990 and 2020, births will outnumber deaths by a little over two million (i.e., natural increase). However, net domestic out-migration is assumed to amount to over 1.5 million. Continued immigration from abroad will bring another million newcomers to Illinois during the same period, according to the Census Bureau's projection. However, conditions could change, so it is possible that Illinois will begin growing through net domestic in-migration, perhaps to areas outside the Chicago metropolitan area. Moreover, people may stop leaving the state. In that case, future population levels would be greater than those presently projected. If, for example, net domestic migration were zero — that is, as many people enter as leave Illinois — the 2020 population would be closer to 14 million.
The Census Bureau projection also assumes a constant level of immigrant settlement of about 35,000 individuals annually. However, since 1990, legal immigration to Illinois has been closer to 45,000 per year. This does not include illegal immigration, which the INS estimates at about 15,000 annually. It seems quite possible, then, that annual immigration is already around 60,000. Furthermore, case studies have shown that once an ethnic base of immigrants is established, that base tends to build on itself as more people, often from the same province, come to join their friends and relatives. Finally, immigrant women from many countries tend to have higher fertility rates than the native born. In addition, some ethnic groups have higher average fertility rates than others, so as the ethnic shares change in Illinois, the overall fertility rate may increase.
If both our assumptions about migration — domestic and international — are fairly accurate, the 2020 population of Illinois could easily surpass 15 million, rather than the 13 million projected by the Census Bureau. If so, by 2020, the state will have gained 3.5 million inhabitants since 1995. Thus, although population growth has been slow in recent decades, this could change if migration patterns — both domestic and international — change.
Yet, a dramatic change in growth patterns seems unlikely. Illinois appears likely to continue to grow very slowly for the foreseeable future. The turn of the century will no doubt see over 12 million Illinoisans, and by 2020, 13 to 14 million people likely will reside in the state.
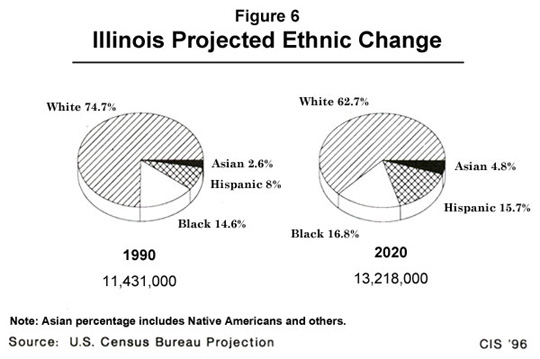
Illinois's ethnic composition, however, will change significantly, especially in the Chicago area. These shifts will pose serious challenges for the state, whether for education, the economy or welfare. According to the Census Bureau's projection, the White share of the population will continue to fall gradually. The Hispanic and Asian shares will grow significantly and Black numbers will continue to rise, aided in part by growing numbers of immigrants from the Caribbean. By 2020, the White share of the state's population could fall to 62.7 percent, with Blacks comprising 16.8 percent, Asians 4.8 percent and Hispanics 15.7 percent (see Figure 6). Of course, the respective shares in the Chicago PMSA would be much different. There, Whites would become a minority of the population, while Hispanics and Blacks would be more numerous.
In numbers, the White population of Illinois is expected to decrease from 8.5 million in 1994 to 8.2 million in 2020, while the Hispanic population will more than double from one to two million. The Asian and Other population likely will grow from 383,000 to 633,000 and the Black population will climb from 1.8 to 2.2 million. Should our own speculations be proven correct, the White share may be somewhat smaller.
Although still almost 63 percent White, Illinois by 2020 will be on its way to becoming a truly multi-racial society. California has already reached the point where no one group predominates numerically. Texas and New York will do so in the foreseeable future. Perhaps Illinois can profit from the experiences of these other states in adjusting to a radically different demographic situation.
The Aging of the Population
Not only will increasing heterogeneity pose new challenges for Illinois, but the state is also getting older, and that, too, portends new problems, such as a higher dependency ratio and increased health care and welfare costs. Over the 1990-2020 period, the rate of growth of Illinois's elderly population (65 and over) will be quite rapid. The population under age 15 will barely grow -from 2.6 million in 1995 to 2.7 million in 2020 and the group aged 45-64 will grow by almost one million — from 2.3 to 3.2 million. During the same period, the 65 and over population will grow from 1.5 million to almost two million. Looking just beyond 2020, when the baby boomers become seniors, Illinois can expect even more rapid growth among its elderly — note again the increases in the 45-64 age group who will later comprise the elderly. Now is the time for the state to begin making plans for the welfare of this rapidly growing segment of its population.
Education
The growth of Illinois from 11 million to possibly 14 or 15 million within a 50-year period is not staggering. However, the challenges posed by the immigration-driven portion of that growth, and its unequal distribution between the Chicago area and the "other Illinois," are considerable. School enrollments provide one example of this challenge. Between 1970 and 1990, public school enrollments rose by only 62,000 students. In 1970, there were 1,099,000 students enrolled in Illinois public schools pre-K through grade 12. By 1990, that number had reached 1,161,000.
Future changes, whether in numbers or in ethnic composition, will be striking. By 2020, over 1.5 million children will be attending the elementary and secondary schools of Illinois compared to about 1.2 million in 1995. If we assume that schools, on average, have about 650 students, according to our projections, Illinois will have to build more than 400 schools over the next quarter of a century. That amounts to well over one school each month for the next 25 years just to keep up with growing enrollments.
The ethnic changes already noted for the total population will be more pronounced among school-age children, as minorities tend to be younger than Whites. By 2020, it is quite possible that Whites no longer will comprise a majority of the public school students in Illinois, as Blacks, Hispanics and Asians increase their respective shares of the student population.
For a number of years, assessments have been made of the level of mathematical and reading skills of students in various grades. While there is some evidence of improvement, Blacks and Hispanics still score behind Whites. (Asians are not included in most analyses because of their small numbers.) Clearly, considerable work and resources are needed if parity among ethnic groups is to be attained. Unless this occurs, the overall quality of the Illinois work force of the future will decline as the share of its population that is Black or Hispanic grows, while the White population shrinks.
The increasingly multilingual school-age population poses additional financial problems for the state. Immigration is playing an important role in growing school enrollments, particularly in Chicago. But the financial impact is felt throughout Illinois. Recall that Chicago alone spends $60 million annually for the education of LEP students. The state Board of Education contributes $31 million and another $2.5 million comes from Federal sources. This is for Chicago schools alone.
It costs about 50 percent more to educate a LEP child than one who is fluent in English. Language training programs will need to be increased as the share of the student population that is non-English-speaking grows. Furthermore, in 1982, the United States Supreme Court ruled that public schools must educate all children between the ages of five and 17 living within a school district, regardless of whether they are in the United States legally. In some areas, this further exacerbates an already difficult and expensive situation.
The cultural implications of ethnic shifts must also be addressed. How will the state's educational system adapt to substantial shifts in enrollment? Will Hispanic and Asian children be immersed into English language training, as was the case with the immigrants of the late 19th century? Will the languages of the motherland be maintained and encouraged? To a considerable extent, the Illinois of the 21st century will be determined by the language training emphasized in the schools, because the labor market of the future will demand an educated and well-trained citizenry.
Transportation
Schools are not the only institutions to be affected by population change and high levels of migration. The problems facing the Illinois transportation infrastructure are growing. Freeways, bridges, railroad tracks, and mass transit (where available) are all deteriorating. In recent decades, traffic has grown much faster than highway capacity.
In 1991, almost 8.2 million motor vehicles were registered in Illinois. The ratio of automobiles and small trucks per 100 people was 71. Today, there are almost as many cars and trucks registered in Illinois as there are adults living there.
In 1990, there were 136,171 miles of highways in the state. So, while Illinois has about 4.5 percent of the U.S. population, it has only about 3.5 percent of the road mileage. More will have to be constructed to keep pace with even modest population growth. This is particularly true as suburbs are extended farther and farther away from the main cities to accommodate the growing population. Only 10.1 percent of Illinois workers used public transportation to get to work in 1990, while 69.9 percent drove to work alone. The result of all this is sprawl and traffic congestion.
Housing
One of the most controversial immigration-related issues currently facing Illinois, and particularly the Chicago area, is the availability of low-cost housing. Because many immigrants have low-wage jobs, they often seek low-cost or subsidized housing, or they find friends, relatives or coworkers with whom they can share housing. In the past few years, local officials in the Chicago area have seen a dramatic rise in the number of immigrants living in basements or attics illegally converted into (often unsafe) apartments. There also has been an increase in overcrowding, with houses and apartments being turned into dormitory-style rooms. During the first week of 1996, two immigrants were killed when a fire trapped them in the basement apartment of the two and one-half story, single family home where they lived with 23 other people.10
At least six Chicago suburbs have passed or are trying to pass local ordinances — ranging from limits on the number of occupants in dwellings to annual inspections of rented single-family homes to increased penalties for illegally converted apartments — in order to address these problems. In addition, a number of state legislators have proposed measures to restrict occupancy and increase the criminal penalties for housing code violations. Some state and local officials pushing for such ordinances have been accused of discrimination against Latinos or other immigrants, since they would be most affected.
The Chicago Housing Authority (CHA), which allocates subsidized housing and provides rent subsidies to poor residents in private housing, also has been a source of controversy recently. A 1995 audit of the CHA by the federal Department of Housing and Urban Development (HUD) alleges that the CHA lost more than $26 million in a period of just three years through a combination of poor management and fraud. In one example of fraud, HUD officials allege that 100 Russian immigrants paid $3,000 to $5,000 each to the director of a homeless shelter so that she would certify them as homeless, thus allowing them to move up on the waiting list for subsidized housing.11
As the low-income population in the Chicago area grows, the shortage of low-cost housing will become more acute. Problems of overcrowding and illegal, unsafe apartments will continue, possibly resulting in further loss of life and exacerbating ethnic and racial tensions.
Environment
Common sense dictates that, if other factors (e.g., consumption) remain equal, any increase in population will also result in an increase in natural resource use, waste generation and pollution. While immigrants are no more or less responsible for environmental degradation than the native-born population, immigration-fueled population growth, and the heavy concentration of this growth in urban areas, is increasing the rate of such degradation. Solid waste disposal and water resources illustrate this.
Solid Waste Disposal
In 1994, Illinois had 59 active non-hazardous waste landfills, down from 146 in 1987, according to the Illinois Environmental Protection Agency (IEPA). The statewide volume of waste produced in 1994 was 47.4 million cubic yards, which was 19 percent less than in 1987, but 16 percent higher than in 1993. At the 1994 average per capita waste generation rate of 6.5 pounds per day, and if population size remained at the 1994 level, the remaining capacity of Illinois's landfills would be exhausted between 2001 and 2003. The situation was worse in the Chicago area, which was home to 16 of the state's landfills in 1994. Again at 1994 rates, the capacity of these landfills was projected by IEPA to be exhausted between 1998 and 2000.
We have noted above that the population of the Chicago area has declined in the past two decades; however, it is not likely to decline enough in the near future to avert the projected landfill shortage. Moreover, the state population is still growing, so regardless of the situation in Chicago, the state will soon have to face the need for new landfill sites or alternative waste disposal methods.
Water Resources
Illinois has a wide range of water resources, including numerous rivers, streams and inland lakes, Lake Michigan and groundwater. In addition, before the state was settled, it had more than eight million acres of wetlands. In 1993, there were only 920,000 acres of wetlands, providing habitat for 40 percent of the state's threatened and endangered species. In the same year, Illinois spent almost $15.4 million on water pollution control and public water provision. That figure does not include $310.9 million spent by the state in 1992 and 1993 on grants and loans for the construction of municipal waste water treatment facilities.
Despite its seemingly vast resources and major expenditures, the state has a number of water-related problems. In the 1992-93 water year (as defined by the IEPA), 12 lakes, sections of four rivers (including the Des Plaines, Illinois and Mississippi Rivers) and all of the Illinois portion of Lake Michigan had sport fish consumption advisories as a result of unsafe levels of pollutants. More than 31 percent of the inland lakes assessed by IEPA were found unsafe for recreational uses. Seven percent of the communities using groundwater have detected volatile organic compounds and 2.5 percent have found pesticides in their water supply.
While agricultural runoff is the primary source of water pollution outside the Chicago area, municipal and industrial point source discharges and urban runoff are the main contributors to poor water quality in the metropolitan area. The Des Plaines River Basin, which encompasses the Chicago area, has the highest levels of heavy metals and organics, including arsenic, lead, DDT and PCBs, in the state. However, Chicago residents rely primarily on Lake Michigan for their water supply. The fish consumption advisory for the Illinois portion of the lake clearly indicates the presence of dangerous pollutants. Moreover, fecal coliform counts exceeded safe standards 23 times on various beaches on the Illinois section of Lake Michigan in 1993.
But water quality is not the only problem facing the Chicago area. At present, Lake Michigan provides water for just over six million Chicagoans. A Supreme Court decree originating in the 1920s, and most recently amended in 1980, limits the amount of water that Illinois can take out of the lake. Illinois is currently in violation of that decree, because more than its share of lake water is required to supply Chicago area residents. The state is in negotiations with other Great Lake states to find a solution that will provide Chicago with adequate water supplies without risking the overall health of Lake Michigan or the other states dependent on it for water.
Crime
Another impact of immigration and population growth is on crime and prisons. The serious-crime rate for Illinois (6,064 per 100,000 population) was slightly higher than that for the nation (5,928 per 100,000). As of January 1996, there are more than 35,500 persons in state prisons, of whom almost 2,000 (5.5%) are immigrants, including an estimated 350 illegal aliens, according to the Illinois Department of Corrections.
The total rate of incarceration amounts to about 265 per 100,000 population. If that rate remains the same, some 7,000 additional prisoners will need to be housed by 2020. However, the rate of incarceration is, in fact, rising. Between 1990 and 1995, the incarcerated population rose by 29.1 percent, while the total population grew by 3.7 percent (nationally, the incarcerated population grew by 30.3%, while the total population grew by 5.8%). The cost of building additional prisons must be added to school, highway, and other infrastructure construction costs.
Welfare
There are other budgetary impacts of immigration -legal and illegal- as well. In addition to education, infrastructure, environmental and incarceration costs, which apply equally to legal and illegal aliens, legal immigrants are entitled to the benefits of our national social safety net and there is clear evidence that some illegal immigrants, though ineligible, also receive benefits through fraud or misrepresentation. According to an analysis of 1990 census data by Harvard economist George Borjas, immigrant households have a higher rate of welfare usage than native households (9.1% versus 7.4%). Moreover, the same analysis shows that the mean welfare income of immigrant households ($5,363) is higher than that of native households ($4,017).12
In the past, it has often been asserted that immigrants contribute more in taxes than they cost in services. But recent studies disprove this assertion. For example, a study of the fiscal impact of immigration by the Center for Immigration Studies found an estimated 1992 net cost of $29 billion per year .That study did not identify a specific cost in Illinois, and program costs vary state by state, but Illinois at that time was thought to account for about 4.8 percent of the nation's foreign-born population (and at least five percent of the illegal alien population ).
Illinois Governor Jim Edgar's office estimated in 1994 that the state spends $153.4 million on services for illegal aliens alone. This figure includes $77.1 million for public education, $43.6 million for incarceration, $24 million for Medicaid coverage and $8.7 million for other programs. Illinois is currently considering a plan to eliminate state funding for non-emergency medical care for pregnant women seeking prenatal, delivery and post-natal services. In May 1994, the state identified 3,045 pregnant illegal immigrants and 1,997 children receiving such services at a cost of $6.6 million.13
Conclusion
Illinois in the twenty-first century will be more populous than it is today unless there are near-term reductions in both migration and fertility, and it will be more heterogeneous. Will Illinois be better off if its population grows to 13 to 15 million? How will its educational system adjust? Will the labor force be able to match the high-tech demands looming in the next century? What will the addition of more Illinoisans do to the environment? Will the state be able to meet the challenges to its transportation system, water resources, waste disposal capacity and other infrastructure? Will it be able to provide low-cost housing for even more needy people? How will the Chicago metropolitan area cope with even more people of diverse backgrounds? Will inter-ethnic peace be possible, or will tensions continue or even intensify? Perhaps particularly important, how will the "two states" get along, as one becomes more heterogeneous while the other remains overwhelmingly White?
These are some of the challenges that all Illinoisans must face up to as a result of the state's demographic shifts. The fact that the growth rate is slow should be viewed as good news. Illinois can take advantage of its current slow growth situation to improve its education, correctional, transportation and other infrastructures. It can encourage low fertility rates among its population and invest in long-term growth-management strategies.
While it is clear that immigrants are not the cause of overcrowded schools, congested highways, environmental degradation, housing shortages, or any of the other problems discussed in this study, they are contributors to all of them. The main thing that differentiates immigrants from the native-born population is the fact that discretionary government policies — either legal immigration policy or the lack of an effective policy to keep out or remove illegal aliens — allow immigrants to be here. Thus, it is foreign immigration which can most directly be shaped by government decisions.
Although immigration policy is largely under the purview of the federal government, there are a number of actions that can be taken at the state level to reduce illegal immigration to Illinois: a policy of cooperation between state and local officials and the INS to prevent illegal aliens from obtaining jobs and taxpayer-funded employment services, housing assistance and welfare benefits; more effective use of its powers to enforce wage, labor and work place safety laws to identify employers of illegal aliens; or a fraud-resistant state driver's license/identification system, like California's, which requires proof of citizenship or legal residence. Perhaps by beginning to address these problems now, the state can offer a better future for all its residents.
However, Illinois cannot do it alone. The federal government, in developing national immigration policy, must take into consideration the impact on jobs, natural resources, infrastructure and public services that result from immigration-fueled population growth. At the very least, the federal government must strengthen its efforts to prevent illegal immigration and to remove those illegal aliens already in the country.
End Notes
1 "Illinois," Encyclopedia Brittanica, p. 235.
2 William Frey, "Immigration and Internal Migration ‘Flight’ from U.S. Metropolitan Areas: Toward a New Demographic Balkanization," Population Studies Center, University of Michigan, 1994.
3 Frey, "Race, Class, and Poverty Polarization of U.S. Metro Areas: Findings from the 1990 Census," Population Studies Center, University of Michigan, 1994.
4 Kristin A. Hansen and Amara Bachu, "The Foreign-born Population: 1994," Current Population Reports, August 1995.
5 According to the Census Bureau, the Chicago PMSA consists of Cook, DuPage and McHenry counties, but does not include adjacent counties in Illinois, Indiana or Wisconsin that are part of the Consolidated Metropolitan Statistical Area (CMSA).
6 Chicago Tribune, October 12, 1995.
7 Since the number of immigrants from Canada is relatively small, most of the foreign-born from the Americas are of Hispanic origin.
8 Chicago Public Schools, “Special Informational Issue on Bilingual Education,” Department of Language and Cultural Education, 1995.
9 Frey, "Immigration and Internal Migration," pp. 742-743.
10 Chicago Tribune, January 10, 1996.
11 Chicago Tribune, June 10, 1995.
12 George J. Borjas, “Immigration and Welfare: 1970-1990,” National Bureau of Economic Research, September 1994.
13 Chicago Tribune, September 15, 1995, and October 24, 1995.
Dr. Leon Bouvier is a Senior Fellow at the Center for Immigration Studies and Adjunct Professor of Demography at the Tulane University School of Public Health. He is also a Visiting Scholar at Stetson University and served as a demographer to the U.S. Select Commission on Immigration and Refugee Policy in 1980.
Rosemary Jenks is a Senior Analyst at the Center for Immigration Studies. She is editor of the Center’s quarterly journal, Immigration Review, and has authored or coauthored a number of Center studies.