Download a PDF of this Backgrounder.
Steven A. Camarota is the Director of Research and Karen Zeigler is a demographer at the Center for Immigration Studies.

The Gang of Eight immigration bill (S.744) passed last June would have roughly doubled the number of new foreign workers allowed into the country, as well as legalized illegal immigrants. Both of New Hampshire’s senators voted for it. An analysis of government data by the Center for Immigration Studies shows that since 2000, 71 percent of the net increase in the number of working-age (16 to 65) people holding a job in New Hampshire has gone to immigrants (legal and illegal) — even though the native-born accounted for 65 percent of population growth among the working-age. As a result, the share of natives holding a job in the state has declined significantly. The decline in employment has been felt primarily by natives without a college education.
Among the findings:
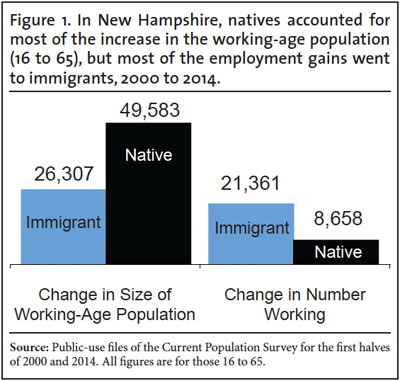
- The total number of working-age (16 to 65) immigrants (legal and illegal) holding a job in New Hampshire increased by 21,000 from the first half of 2000 to the first half of 2014, while the number of working-age natives with a job increased by just 8,700 over the same period.
- The fact that more than two-thirds of the overall net gain in employment among the working age went to immigrants (legal and illegal) is striking because natives accounted for 65 percent of the increase in the total size of the state’s working-age population.
- While difficult to measure, our best estimate is that perhaps one-third (7,000) of the increase in immigrant employment since 2000 in the state was among illegal immigrants.1
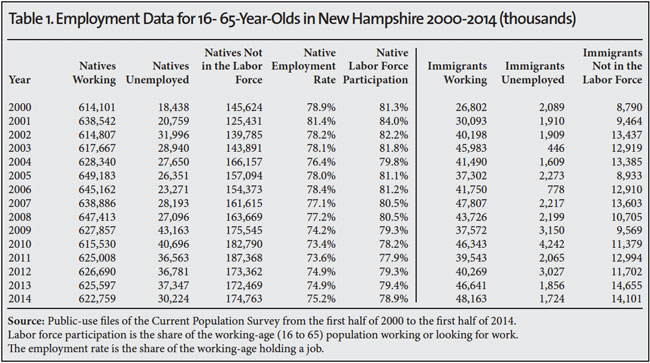
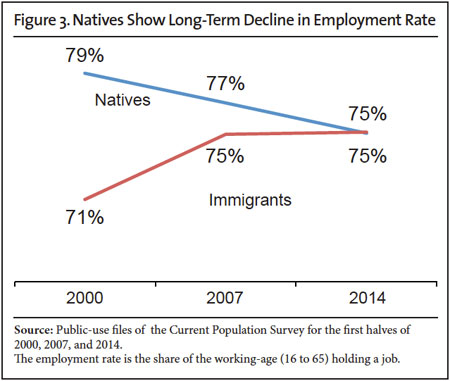
- In the first half of this year, 75 percent of working-age natives in the Granite State held a job. As recently as 2000, 79 percent of working-age natives were working.
- Because the native working-age population in New Hampshire grew significantly, but the share working actually fell, there were nearly 41,000 more working-age natives not working in the first half of 2014 than in 2000 — a 25 percent increase.
- The supply of potential workers in New Hampshire is very large: In the first half of 2014, 205,000 working-age natives of all education levels were not working (unemployed or entirely out of the labor market) as were 16,000 working-age immigrants.
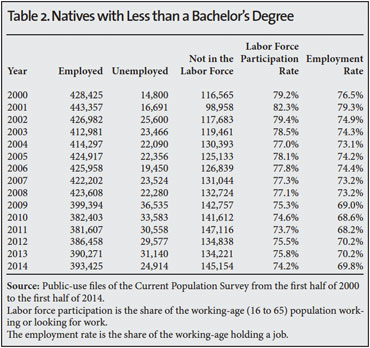
- Of working-age natives not working, the overwhelming majority (170,000) do not have a college education. Prior research indicates that the vast majority of illegal immigrants also do not have a college education, and therefore mostly compete with less-educated natives for jobs.2
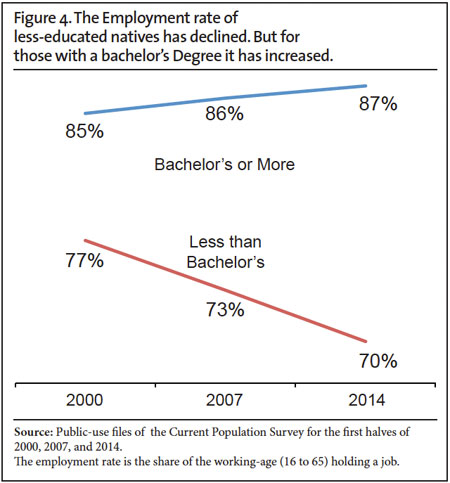
- All of the decline in the employment rate (share working) among working-age natives in New Hampshire has been among the less-educated. The employment rate for natives in the state without a college degree declined from 77 percent in 2000 to 70 percent in the first half of 2014. In contrast, it increased from 85 to 87 percent for natives with at least a bachelor’s degree over the same time period.
- Two conclusions from the state’s employment situation:
- First, the long-term decline in employment for natives in New Hampshire and the large number of working-age natives not working clearly indicates that there is no general labor shortage in the state — especially among the less educated. Thus it is very difficult to justify the large increases in foreign workers (skilled and unskilled) allowed into the country in a bill like S.744, which many of the state’s politicians support.
- Second, New Hampshire’s working-age immigrant population grew 70 percent from 2000 to 2014. Yet the number of working-age natives working in 2014 was only slightly above the number in 2000 and the share with a job actually fell. This undermines the argument that immigration on balance increases job opportunities for natives.
Data Source
The analysis is based on the “household survey,” collected by the government. The survey is officially known as the Current Population Survey (CPS), and is the nation’s primary source of information on the labor market.3 Many jobs are created and lost each year and many workers change jobs as well. But the number of people employed reflects the net effect of these changes. We focus on the first half of each year 2000 to 2014 in this analysis because comparing the same part of the year over time controls for seasonality. Also combining six months of the CPS allows us to have more robust estimates for a small state like New Hampshire. We emphasize the economic peaks in 2000 and 2007 as important points of comparison, though we provide data for all years since 2000. We report figures for January to June between 2000 and 2014 in Table 1.
This analysis focuses on those 16- to 65-years-old, so that we can examine the employment rate (share working) of native-born Americans.4 The employment rate is a measure of labor force attachment that is less sensitive to the business cycle compared to the often-cited unemployment rate. Immigrants or the foreign born (legal and illegal) are individuals who are not U.S. citizens at birth.

End Notes
1 Based on the characteristics of immigrants in New Hampshire, we estimate that there were 13,000 working-age illegal immigrants in the state holding a job in the first half of 2014, compared to 6,000 in the first half of 2000, for a growth of 7,000. This means that about a quarter of the immigrants holding a job in the state are in the country illegally. While these estimates are consistent with those developed by the Pew Hispanic Center, it must be remembered that New Hampshire is a small state and this creates significant uncertainty for any estimate of the illegal immigrant population based on the CPS. Therefore, these estimates should be interpreted with caution. See Table A3 in Jeffrey S. Passel and D’Vera Cohn, “Unauthorized Immigrant Population: National and State Trends”, Pew Hispanic Center, 2010.
2 The Pew Hispanic Center has estimated that 15 percent of illegal immigrants have at least a bachelor’s degree. See Jeffrey S. Passel and D’Vera Cohn, “A Portrait of Unauthorized Immigrants in the United States”, Pew Hispanic Center, 2009. The Heritage Foundation has estimated that about 10 percent of illegal immigrants have a high school education. See Robert Rector and Jason Richwine, “The Fiscal Cost of Unlawful Immigrants and Amnesty to the U.S. Taxpayer”, Heritage Foundation, 2013.
3 We do not use the “establishment survey”, which measures employment by asking businesses because that survey is not available to the public for analysis. Equally important, it does not ask if an employee is an immigrant. The survey does not include those in institutions such as prisons.
4 Those 16 to 65 years of age account for some 95 percent of all workers. When examining the share working or in the labor force, it is necessary to limit the age range because, although the under-16 and over-65 populations are quite large, only a small share work.