Download this Backgrounder as a pdf
Each month the Census Bureau conducts the Current Population Survey (CPS), the primary purpose of which is to collect employment data. The March CPS includes an extra-large sample of Hispanics and is considered the best source for information on persons born outside of the United States — referred to as foreign-born by the Census Bureau, though for the purposes of this report, foreign-born and immigrant are used synonymously.1 Analysis of the March 2000 CPS done by the Center for Immigration Studies indicates that 28.4 million immigrants now live in the United States, the largest number ever recorded in the nation’s history, and a 43 percent increase since 1990. As a percentage of the population, immigrants now account for more than one in 10 residents (10.4 percent), the highest percentage in 70 years.
Other findings in the new Center report:
- More than 1.2 million legal and illegal immigrants combined now settle in the United States each year.
- The number of immigrants living in the United States has more than tripled since 1970, from 9.6 million to 28.4 million. As a percentage of the U.S. population, immigrants have more than doubled, from 4.7 percent in 1970 to 10.4 percent in 2000.
- By historical standards, the number of immigrants living in the United States is unprecedented. Even at the peak of the great wave of early 20th century immigration, the number of immigrants living in the United States was less than half what it is today (13.5 million in 1910).
- Immigration has become the determinate factor in population growth. The 11.2 million immigrants who indicated they arrived between 1990 and 2000 plus the 6.4 million children born to immigrants in the United States during the 1990s are equal to almost 70 percent of U.S. population growth over the last 10 years.
- The percentage of immigrants without a high school diploma is 30 percent, more than three times the rate for natives. Also, of all persons without a high school education, one-third are now immigrants. Immigrants are also slightly more likely than natives to have a graduate or professional degree.
- In 2000, 37.4 percent of immigrants are naturalized citizens, and immigrants account for 5.5 percent of all eligible voters.
- The poverty rate for immigrants is 50 percent higher than that of natives, with immigrants and their U.S.-born children (under age 21) accounting for 22 percent of all persons living in poverty.
- The proportion of immigrant households using welfare programs is 30 to 50 percent higher than that of native households.
- One-third of immigrants do not have health insurance — two and one-half times the rate for natives. Immigrants who arrived after 1989 and their U.S.-born children account for 60 percent or 5.5 million of the increase in the size the uninsured population.
- Immigration accounts for virtually all of the national increase in public school enrollment over the last two decades. In 2000, there were 8.6 million school-age children from immigrant families in the United States.
- Immigrants and natives exhibit remarkably similar rates of entrepreneurship, with about 1 in 9 of both groups being self-employed.
Because all children born in the United States to immigrants are by definition natives, the sole reason for the dramatic increase in the immigrant population is new immigration. While some immigrants die and others return home, the issuance of 700,000 to 900,000 permanent residency visas annually and the settlement of several hundred thousand illegal aliens each year greatly exceeds deaths and out-migration. In the March 2000 CPS, just under three million immigrants indicated they had entered the country between 1998 and March of 2000. An additional 2.2 million immigrants responded they had arrived in 1996 or 1997. These numbers indicate that at least 1.2 million immigrants, and perhaps 1.3 million, now arrive in United States each year.
In any discussion of immigration’s effect on the country it is important to keep in mind that the number of legal immigrants allowed in each year, the selection criteria used, and the level of resources devoted to controlling illegal immigration are all discretionary policies of the federal government. Given the sampling and non-sampling error that exists in any survey, the results of this Backgrounder for states and immigrant groups with relatively small populations should be interpreted carefully.
Historical Comparison
While immigration has played an important role in American history, the level of immigration and the size of the immigrant population has varied considerably. Figure 1 shows the number of immigrants living in the United States over the course of the last 100 years. The 28.4 million immigrants residing in the United States in 2000 are the most ever recorded. Even during the great wave of immigration at the turn of the century, the immigrant population was less than half what it is today.
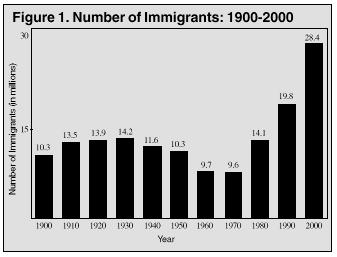
Figure 1 shows that, after growing in the early part of this century, the immigrant population stabilized at around 10 or 11 million for about four decades. In the mid-1960s, changes in immigration law and other factors caused the annual level of legal immigration to rise steadily, from about 300,000 in the 1960s to 800,000 in the 1990s. As a result, between 1970 and 1980 the number of immigrants living in the United States grew by a record 4.5 million. Reflecting the continuing increase in legal and illegal immigration, the immigrant population grew by 5.7 million in the 1980s — another record — and by 8.6 million in the 1990s, again surpassing the previous record.
The foreign-born population’s growth rate since 1970 is higher than at any other time in history, far surpassing growth at the beginning of the 20th century. Between 1900 and 1910, the immigrant population grew by 31 percent, less than the 47 percent increase in the 1970s, the 40 percent increase in the 1980s, and the 43 percent growth of the 1990s.
Additionally, immigrants now account for a much larger share of the increase in the total U.S. population. For most of last century, the growth in the immigrant population accounted for little or none of the increase in the size of the U.S. population. Even during the first decade of the last century, when immigration was an important part of population growth, the immigrant contribution to U.S. population growth was much less than it is today. The 3.2 million increase in the size of the immigrant population between 1900 and 1910 accounted for only 20 percent of the total increase in the U.S. population. In contrast, the 8.6 million-increase in the immigrant population from 1990 to 2000 accounted for 34 percent of U.S. population growth in the 1990s. Immigration now accounts for such a large percentage of population because the fertility of natives was much higher in the early 1900s. As a result, the population grew regardless of immigration. Today natives have only about two children on average, with the result that immigration now accounts for a very large share of population growth. Also in contrast to the past, a much higher percentage of today’s immigrants remain in the United States rather than returning home. Because so many immigrants in the early 20th century eventually returned to their home countries, immigration at that time did not add permanently to the overall size of U.S. population in the way that it does today.2
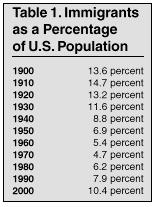
While the number of immigrants and the growth rate of the immigrant population are higher now than at any other time in the last 100 years, the immigrant percentage of the population was higher in the first few decades of the 1900s. Table 1 shows that in 1910, the immigrant population reached a high of 14.7 percent of the total U.S. population. As a result of World War I and changes in immigration law in the early 1920s, the level of immigration began to fall, as did the foreign-born percentage of the population. The 1930 Census was the last time the percentage of immigrants was as high as it is today.
In terms of the impact of immigrants on the United States, both the percentage of the population made up of immigrants and the number of immigrants are clearly important. The ability to assimilate and incorporate immigrants is partly dependent on the relative sizes of the native and immigrant populations. Still, 28.4 million immigrants are likely to have an enormous effect on the socio-economic life of the United States, regardless of whether this represents 10 or 15 percent of the nation’s population, especially because immigrants are largely concentrated in only a few states.
Population Growth
The CPS can be used to provide insight into the likely impact of immigrants on the size of the U.S. population. Table 2 reports six different methods using the March 2000 CPS to estimate the effect of immigration on U.S. population growth in the 1990s.
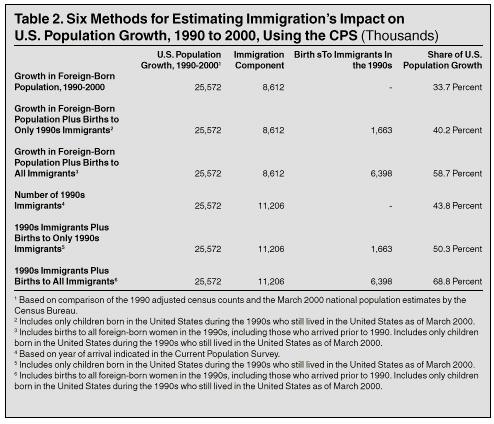
The first column in Table 2 shows the growth in the U.S. population based on a comparison of the total population as enumerated in the 1990 Census and the March 2000 population estimate prepared by the Census Bureau.3 The first three rows of Table 2 use the growth in the size of foreign-born population to estimate the effect of immigration on population growth between 1990 and 2000. As already pointed out, the 8.6 million increase in the size of the immigrant population between 1990 and 2000 is equal to approximately one-third of total U.S. population growth over this period. As shown in the second row, the impact of immigration on population growth is even larger (40 percent) if births to immigrants who arrived in the 1990s are added to the growth of the foreign-born population. The third row indicates that if births to all immigrant women during the 1990s, including those who arrived prior to 1990, are added to the growth in the immigrant population, then immigration is equal to almost 59 percent of population growth.
Instead of using the growth in the foreign-born population, the last three rows of Table 2 use the number of immigrants who arrived in the 1990s as the basis for estimating the impact of immigration on population growth. Analysis of this kind is possible because the CPS asks of foreign-born persons their year of arrival to the United States. In 2000, 11.2 million immigrants in the survey indicated that they had entered the country between 1990 and 2000.
The 11.2 million figure is larger than the 8.6 million growth in the foreign-born because the immigrant population shrinks as a result of deaths and out-migration. Thus, even though 11.2 million immigrants arrived in the 1990s, the immigrant population grew by only 8.6 million because 2.6 million immigrants here in 1990 had either died or gone home by 2000. It is reasonable to view the 11.2 million immigrants who arrived in the 1990s as the basis for estimating immigration’s effect on population growth because this flow reflects current U.S. immigration policy — both legal immigration and the level of resources devoted to controlling illegal immigration.
The 11.2 million immigrants who arrived in the 1990s are equal to 43.8 percent of population growth in the 1990s. If births only to immigrants who arrived during the 1990s are added to this figure, then immigration accounts for 50.3 percent of U.S. population growth. The last row in Table 2 adds all births to immigrants between1990 and 2000 to the 11.2 million immigrants who arrived in the 1990s. Births to immigrants plus 1990s immigration are equal to 68.8 percent of population growth between 1990 and 2000. Taken together, the estimates in Table 2 make clear that no matter what assumption is used, immigration policy has very significant implications for U.S. population growth.
State Data
Table 3 ranks the states by the size of their immigrant populations. It also shows the number of immigrants who reported arriving in the 1990s. California clearly has the largest immigrant population; New York, the state with next largest number of immigrants, has fewer than half as many. Table 3 also shows how concentrated the immigrant population is: Only a few states represent the vast majority of the foreign-born population. The nearly 8.8 million immigrants in California account for 30.9 percent of the nation’s total immigrant population, followed by New York (12.8 percent), Florida (9.8 percent), Texas (8.6 percent), New Jersey (4.3 percent), and Illinois (4.1 percent). Despite having only 39.3 percent of the nation’s total population, these six states account for 70.5 percent of the nation’s immigrant population.
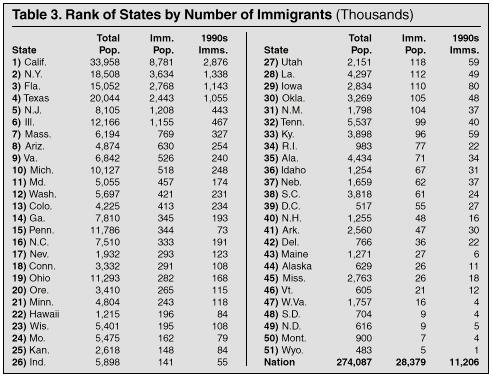
Table 4 ranks states by the percentage of their populations composed of immigrants. While the rankings by "percent immigrant" are similar to those in Table 3, there are some significant differences. Because of their relatively small total populations, several states such as Hawaii and Nevada, with high percentages of immigrants, rank lower in terms of number of immigrants.
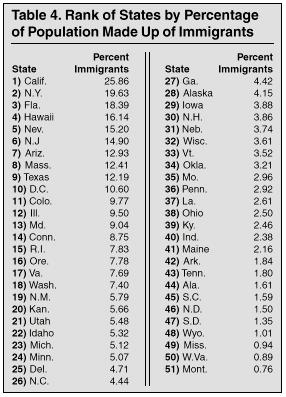
Table 5 compares the 1990 Census counts of the immigrant population with the March 2000 CPS and ranks the top 15 states by the numerical increase in their immigrant populations. While the states that had large immigrant populations in 1990 continue to account for most of the growth in the immigrant population, Table 5 shows substantial growth in the foreign-born populations in such states as Arizona, Colorado, North Carolina, and Nevada.
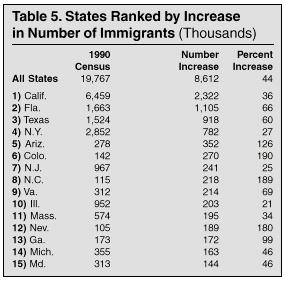
Table 6 examines immigration and state population growth for the top immigrant- receiving states. The first column in the table reports population growth between 1990 and 2000 by state. Columns 2, 3, and 4 show the number of 1990s immigrants in the state, births to 1990s immigrants, and births to all immigrants during the 1990s. Column 5 uses 1990s immigrants plus births to only 1990s immigrants, while column 6 uses 1990s immigrants and all births to immigrants to estimate immigration’s impact on state population growth. Table 6 shows that using either assumption, there are a number of states in which immigration has had a very large impact on population growth.
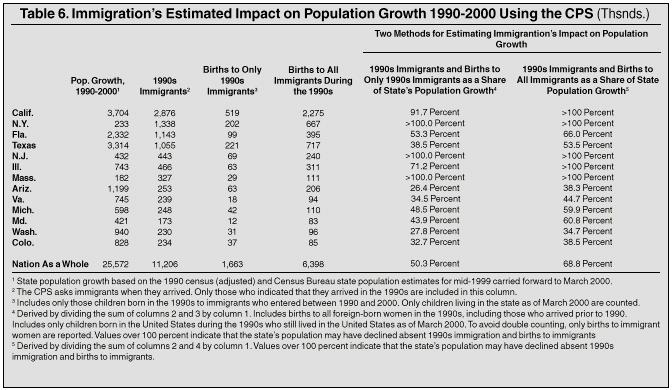
While the arrival of natives from other parts of the country plays a significant role in population growth in states like Arizona, Washington, and Colorado, immigration has also become an important component of population growth. For Virginia, Maryland, Michigan, Florida, and Texas, immigration plays an even larger role — accounting for at least one-third to more than half of the increase in the population of these states between 1990 and 2000.
In New York, New Jersey, Massachusetts, Illinois, and California it appears that absent immigration, these states may have declined in population or at least grown very little. This is because there is a significant out-migration of natives from these states. There is, however, both anecdotal and systematic evidence indicating that in high- immigration states some natives leave because they are adversely affected by immigration. In particular, less-skilled native-born workers may leave to avoid job competition, and some parents may leave high-immigration areas because of the strains it creates on public schools. Therefore, it is by no means certain that without immigration all of these states would have declined in population.
Region and Country of Origin
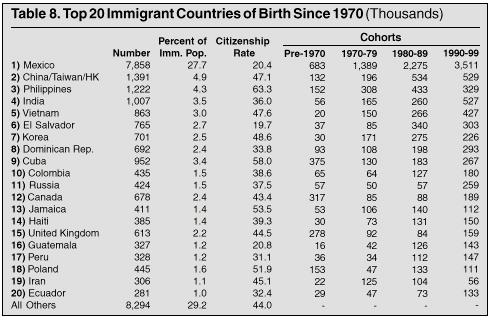
Table 7 shows the distribution of immigrants by region of the world, with Mexico and Canada treated separately. Mexico accounts for 27.7 percent of all immigrants, with 7.9 million immigrants living in United States, more than the number of immigrants from any other part of the world. Immigrants from Mexico, Central and South America, the Caribbean, and East Asia make up the majority of immigrants, with 69 percent of the foreign-born coming from these areas. For immigrants who have arrived in the 1990s, these regions account for 71.2 percent of the foreign-born. Sub-Saharan Africa and Europe make up a relatively small portion of the immigrant population, accounting for only 17.1 percent of all immigrants and 13.8 percent of immigrants who arrived in the 1990s.
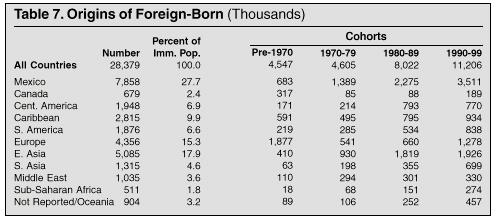
Table 8 ranks the top-20 immigrant-sending countries by the number of post-1970 immigrants living in the United States as of March 2000. Mexico is, of course, the largest sending country, accounting for more than five times as many immigrants as the combined total for China, Taiwan, and Hong Kong. As is clear from Table 8, Latin American, Caribbean, and East Asian countries dominate the list of immigrant-sending countries, accounting for 14 of the top-20 post-1970 countries.
Labor Market Characteristics
Immigrants now comprise 12.8 percent of the nation’s total workforce.4 This is somewhat higher than the 10.4 percent of the total U.S. immigrant population because, in comparison to natives, a slightly higher percentage of immigrants are of working age. Table 9 reports the educational attainment and other characteristics of immigrants and natives in the workforce. In 1998, almost 30 percent of immigrants who worked full time did not have a high school diploma, and of those who arrived in the 1990s, 34.4 percent were dropouts. In comparison, slightly less than 9 percent of natives lacked a high school education. At the highest level of education, immigrants tend to be slightly more educated than natives, with 10.7 percent of immigrants holding a graduate or professional degree compared to 9.3 percent of natives.
The large number of immigrants with low levels of education means that immigration policy has dramatically increased the supply of workers with less than a high school degree, while increasing other educational categories more moderately. The last column in Table 9 shows the portion of each educational category composed of immigrants. While immigrants comprise 13 percent of the total workforce, they comprise more than 35 percent of the high school dropouts in the workforce. This means that any effect immigration may have on the wages or job opportunities of natives will disproportionately affect less-skilled workers.
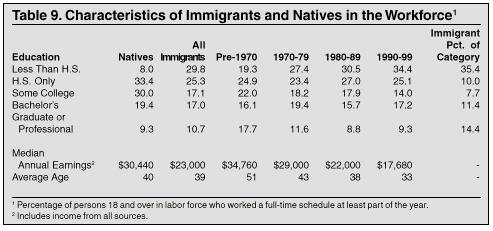
Given the large proportion of immigrants with few years of schooling, it is not surprising that the income figures reported in Table 9 show that as a group, immigrants have lower median incomes than natives. The annual median income of immigrants is only about 76 percent that of natives. And for the most recent immigrants, median income is only 58 percent that of natives. While as a group immigrants earn significantly less than natives, the income data by year of entry suggest significant progress over time.
Since the cohort data is only based on one point in time, March 2000, it is possible that the seeming economic progress of immigrants is at least partly caused by the departure of those immigrants who did not fare well in the U.S. labor market. Moreover, the age data in Table 9 indicate that 1970s immigrants are by 2000, on average, older than natives in the workforce. Because greater workforce experience comes with age, one would expect this to translate into higher income. Despite this, the median income of immigrants who arrived in the 1970s is actually slightly below that of natives, even though they are on average older than natives and have been in the United States for more than 20 years. Only the cohort that arrived before 1970 had higher incomes than natives, which is expected given that they are much older than natives on average. In addition to their age, the higher income of immigrants who arrived prior to 1970 may also be explained by the fact that most were admitted under the pre-1965 immigration system, which tended to produce a more educated flow of immigrants relative to natives than today’s policies.
Table 10 shows the occupational concentration of immigrants and natives by occupation. The upper half of the table lists those occupations in which the immigrant component is less than or nearly equal to their proportion in the overall workforce. The lower half lists those occupations in which immigrants comprise a proportion larger than their representation in the workforce (henceforth referred to as low-immigrant and high-immigrant occupations, respectively). Given the low level of educational attainment of a large proportion of immigrants, it is not surprising that high-immigrant occupations are those that tend to require fewer years of education. For example, while immigrants make up 18 percent of those holding non-private household service jobs, such as janitor, security guard, and child-care worker, they comprise only 10 percent of individuals in managerial and professional jobs.
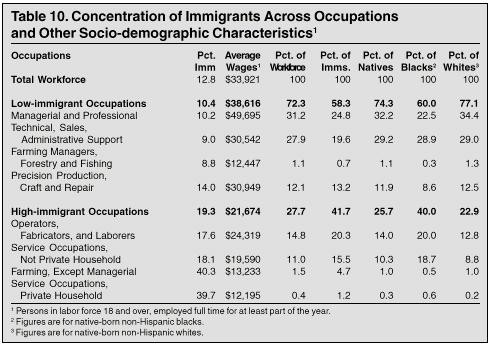
Table 10 reveals that only 26 percent of natives are employed in occupations that have a high concentrations of immigrants. This suggests that most natives are not in competition with immigrants.5 However, as Table 10 shows, high-immigrant occupations pay an average of only 56 percent of what low-immigrant occupations pay. Additionally, high-immigrant occupations have an unemployment rate more than double that of low-immigrant occupations. By itself, this does not necessarily mean that immigrants have lowered the wages or increased unemployment in these occupations. What it is does mean, however, is that any negative effect from immigration will likely fall on the 26 million native-born workers who already have the lowest wages and the highest unemployment.
Table 10 also shows that 40 percent of native-born blacks work in high-immigrant occupations, compared to only 22.9 percent of whites. This means that blacks are much more likely to be affected by any decline in wages or benefits resulting from immigrant-induced increases in the supply of labor.
Self Employment
One of the most common perceptions of immigrants is that they are uniquely or distinctly entrepreneurial. Table 11 examines the self-employment rates of immigrants and natives. Consistent with other research, Table 11 shows that immigrants and natives exhibit remarkably similar levels of entrepreneurship. The table shows that 10.7 percent of immigrants and 11.6 percent of natives are self-employed. Thus, less than one percentage point separates the self-employment rate for immigrants and natives. Turning to self-employment income reported at the bottom of Table 11, we see that the average self-employment income (revenue minus expenses) or both immigrants and natives is very similar. While immigrants overall are not more entrepreneurial than natives, immigrants from some countries are significantly more likely than natives to be self-employed. Those from China, Korea, Canada, Poland, and Iran are much more likely to be self-employed than natives.
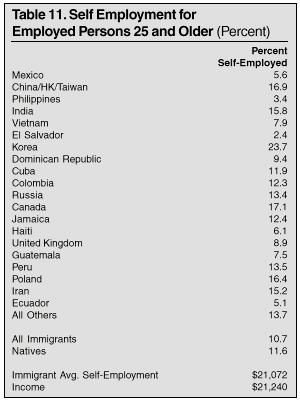
Clearly, entrepreneurship is neither a lacking nor a distinguishing characteristic of the nation’s immigrants. If one removed immigrants from the data, the overall rate of self-employment in the United States would be virtually unchanged. Therefore, one simply must look elsewhere to make an argument for or against current immigration.
Poverty
Based on the March 2000 CPS, 16.8 percent of immigrants compared to 11.2 percent of natives lived in poverty in 1999 (poverty statistics are based on annual income in the year prior to the survey). The poverty rate is 23.5 percent for immigrants who entered in the 1990s, 15.2 percent for 1980s immigrants, and 11.5 percent for 1970s immigrants. As is the case with the income data in Table 9, it is unclear to what extent this progress reflects the out-migration of unsuccessful immigrants, the different selection criteria used in the past, and the changing origins of immigrants over the last few decades.
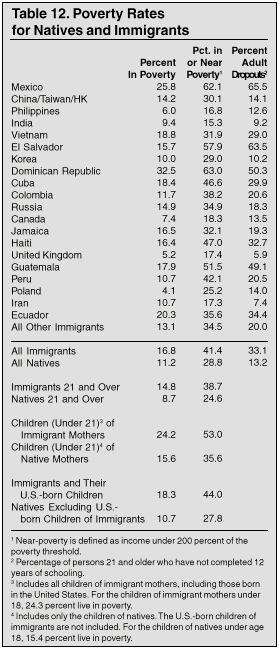
Table 12 also reports poverty rates for persons from the top-20 post-1970 immigrant-sending countries. The data indicate that there is an enormous variation in poverty rates among immigrants from different countries. For example, the 32.5 percent poverty rate for Dominicans is more than six times that of persons from United Kingdom and five times that of immigrants from the Philippines. The last column in Table 12 shows the proportion of persons 21 years of age and older from each country who have not completed high school. These educational data indicate that those countries that have the highest percentage of adults without a high school education also tend to have the highest poverty rates.
The higher incidence of poverty among immigrants as a group has significantly increased the overall size of the population living in poverty. Immigrants accounted for almost 15 percent of all persons living in poverty. While this is a large percentage, it would be even larger if the native-born children (under age 21) of immigrants, who are included in the poverty figures for natives, are counted with their parents. The poverty rate for children and for most young adults reflects their parents’ income, therefore it is reasonable to view poverty among the U.S.-born children of immigrants as attributable to their immigrant parents. The bottom portion of Table 12 shows that the poverty rate for immigrants and their U.S.-born children together is 18.3 percent.
Of the 27.5 million natives living in poverty, 2.27 million (8 percent) are the U.S.-born children of immigrant mothers. If the native-born children of immigrants are excluded, poverty among natives drops from 11.2 percent to 10.7 percent. And if the 4.75 million immigrants in poverty are also excluded, along with their U.S.-born children, from the nation’s overall poverty counts, the overall number of people living in poverty drops by 7.02 million. This means that immigrants and their U.S.-born children account for 21.8 percent of the 32.26 million people living in poverty in the United States. Among persons under age 21 living in poverty, 24.2 percent are the children of immigrants.
In addition to poverty, Table 12 also reports the percentage of immigrants and natives living in or near poverty, with near poverty defined as income less than 200 percent of the poverty threshold. As is the case with poverty, near poverty is much more common among immigrants rather than natives. Table 12 shows that 41.4 percent of immigrants compared to 28.8 percent of natives live in or near poverty. Among the children of immigrants (under age 21), 53 percent live in or near poverty, in contrast to 35.6 percent of the children of natives. If the native-born children of immigrants are excluded from the figures for natives, the rate of poverty/near poverty among natives drops from 28.8 percent to 27.8 and the poverty rate is 44 percent for immigrants and their native-born children combined. If the 11.7 million immigrants in or near poverty are excluded, along with their U.S.-born children (5.17 million), then the overall number of people living in or near poverty in the United States drops by 16.9 million. This means that immigrants and their U.S.-born children account for 20.5 percent of the poor and near poor in the United States.
Welfare Use
Table 13 shows the percentage of immigrant- and native-headed households in which at least one member of the household receives public assistance (including Temporary Assistance to Needy Families and general assistance programs), Supplemental Security Income (SSI), Food Stamps, or Medicaid (health insurance for those with low incomes). Table 13 indicates that even after the 1996 welfare reforms, which curtailed eligibility for some immigrants, immigrant welfare use remains higher than that of natives for all four major programs and for all entering cohorts after 1970. In fact, the year of entry data suggest that in some cases immigrant welfare use actually rises over time as they “assimilate” into the welfare system.
As was the case with lower income and higher poverty rates, the higher welfare use rates by immigrant households are at least partly explained by the large proportion of immigrants with few years of schooling. Less-educated people tend to have lower incomes and higher levels of unemployment and poverty. Therefore, it is not surprising that immigrant use of welfare programs is significantly higher than that of natives.
While immigrants’ welfare use is higher than natives’, Table 13 shows that most households, immigrant or native, do not use means-tested programs. On the other hand, even though a relatively small portion of the population uses welfare, for 1999 the total costs of just the first three programs listed in Table 13 is more than $70 billion a year, and Medicaid by itself costs an additional $190 billion. Moreover, there are other welfare programs not listed in the table that are linked to those reported in Table 13. For example, 15.5 percent of immigrant households reported having at least one child receiving subsidized school lunches, compared to only 5.8 percent of native households. Finally, there is the question of whether native use of welfare is the proper yardstick by which to measure immigrants. Some may reasonably argue that because immigration is supposed to benefit the United States, our admission criteria should, with the exception of refugees, select only those immigrants who are self-sufficient.
In addition to welfare programs, Table 13 reports use of the Earned Income Tax Credit (EITC). With an annual cost of $25 billion, the EITC is the nation’s largest means-tested cash assistance program for workers with low incomes. Persons receiving the EITC pay no federal income tax and instead receive cash assistance from the government based on their earnings and family size. Table 13 shows that immigrant households use the EITC at almost double the rate of natives.
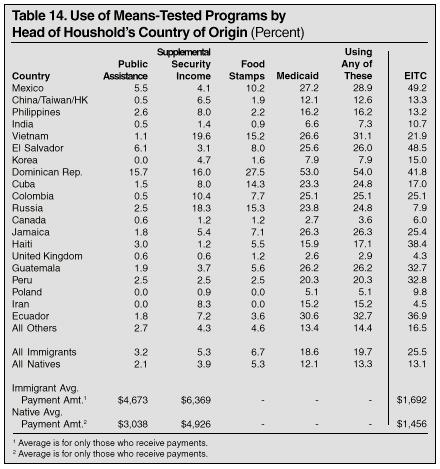
While on the whole immigrant households have higher welfare use rates, this is not true for immigrants from all countries. Table 14 shows that immigrants from those countries with higher education levels tend to have lower welfare use rates. From the list of countries in Table 14, it is also clear that refugee-sending countries, such as Russia and Vietnam, tend to have higher rates of welfare use. On the other hand, Mexican and Dominican households have welfare use rates that are as high or higher than Russian or Vietnamese immigrants, and virtually none of these immigrants are refugees. Thus, it is clear that the higher rate of welfare use by immigrants overall is not caused simply by immigrants admitted for humanitarian reasons. In addition to being more likely overall to receive welfare, Table 14 indicates that the average payments received by immigrant households on public assistance, SSI, or the EITC are larger than those of natives.
Uninsured
According to the Census Bureau, since 1989 the uninsured population has grown by almost 9.2 million. and stood at 42.6 million (almost one-sixth of the total U.S. population) in 1999. (Figures for 1999 are based on the March 2000 CPS.) Much of this growth has been driven by immigration. Immigrants who arrived after 1989 along with their U.S.-born children account for 60 percent or 5.5 million of the increase in the uninsured population in the 1990s.6
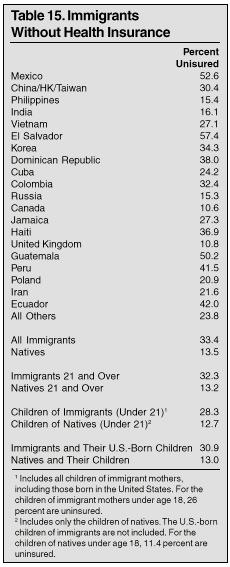
Table 15 reports the percentage of immigrants and natives who where uninsured for all of 1999. The table shows that lack of health insurance is a significant problem for immigrants from many different countries, including countries that tend to have lower poverty rates and higher education levels, such as China and Korea. The lower portion of Table 15 reports the percentage of immigrants and their U.S.-born children (under 21) who are uninsured. Almost 31 percent of immigrants and their children lack health insurance, compared to 13 percent of natives. The large percentage of immigrants and their children without insurance has significantly increased the overall size of the uninsured population. Immigrants and their U.S.-born children account for almost 28 percent of all uninsured persons in the country, double their percentage of the overall population. The high percentage of immigrants without health insurance is even more striking when one recalls from Table 13 that immigrant households were more likely to use Medicaid.
The low rate of insurance coverage associated with immigrants is primarily explained by their much lower levels of education. Because of the limited value of their labor in an economy that increasingly demands educated workers, many immigrants hold jobs that do not offer health insurance, and their low incomes make it very difficult for them to purchase insurance on their own.
A larger uninsured population cannot help but strain the resources of those who provide services to the uninsured already here. Moreover, Americans with insurance have to pay higher premiums as health care providers pass along some of the costs of treating the uninsured to paying costumers. Taxpayers also are affected as federal, state, and local governments struggle to provide care to the growing ranks of the uninsured. There can be no doubt that by dramatically increasing the size of the uninsured population, our immigration policy has broad-ranging effects on the nation’s entire health care system.
School-Age Children
In the last few years, a good deal of attention has been focused on the dramatic increases in enrollment experienced by many school districts across the country. The Department of Education recently reported that the number of children in public schools has grown by nearly 8 million in the last two decades. All observers agree that this growth has strained the resources of many school districts. While it has been suggested that this increase is the result of the children of baby boomers reaching school age (the "baby boom echo"), it is clear from the CPS that immigration policy explains the growth in the number of children in public schools.
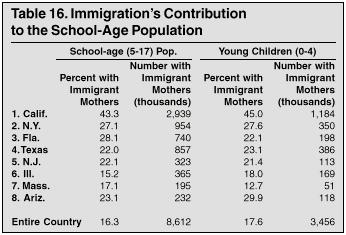
Table 16 shows that there are 8.6 million school-age children of immigrants (ages 5 to 17) in the United States. While fewer than one-third of the 8.6 million children are immigrants themselves, the use of public education by the native-born children of immigrants is a direct consequence of their parents having been allowed into the country. The children of immigrants account for such a large percentage of the school-age population because a higher proportion of immigrant women are in their childbearing years, and immigrants tend to have more children than natives. In addition, the effect of immigration on public schools will be even larger in the coming years because 17.6 percent of children approaching school age have immigrant mothers.
Table 16 also shows that immigration has significantly increased the school-age population in all of the top-eight immigrant-receiving states. Of course, a dramatic increase in enrollment may not create a problem for public education if tax revenue increases proportionately. But as we have seen, immigrants generally have lower incomes than natives, so their tax contributions are unlikely to entirely offset the costs they impose on schools. This is especially true because of the higher costs associated with teaching children whose first language is not English.
The absorption capacity of American public education is clearly an important issue that needs to be taken into account when formulating a sensible immigration policy. Table 16 suggests that the failure to consider this question may have significant consequences for America’s schools.
Characteristics of Immigrants by State
Table 17 reports selected characteristics for immigrants in the leading immigrant-receiving states. The first column reports the percentage of immigrants 18 and over in each state who indicated that they were naturalized citizens of the United States. While there is some variation, the percentage of immigrants in most states who are citizens falls near the national average of 40 percent. As a share of all eligible voters in each state, immigrants vary significantly: in California immigrants account for 15.7 percent of eligible voters; in New York, 11.8 percent; in Florida, 10.8 percent; in Texas, 5.6 percent; in New Jersey, 9 percent; in Illinois, 5.2 percent; in Massachusetts, 6.5 percent; and in Arizona, 6 percent. It is worth noting that research indicates that some immigrants, primarily those from Mexico and Central America, tend to report that they are naturalized citizens when in fact they are resident aliens. Thus, the actual citizenship rate of immigrants is likely to be somewhat overstated in the CPS.
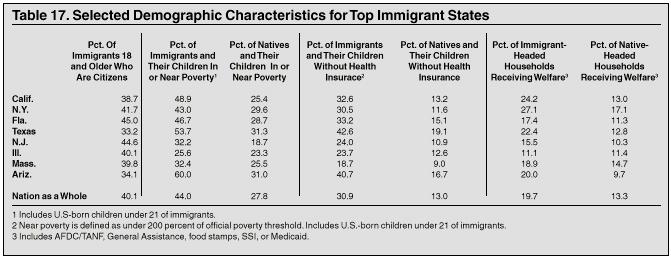
The second and third columns of Table 17 report the percentage of immigrants and their U.S.-born children (under 21) who live in or near poverty, with near poverty defined as income below 200 percent of the poverty threshold. Despite the fact that the demographic characteristics of immigrants differ significantly by state, immigrants and their U.S.-born children (under age 21) have much higher rates of poverty and near poverty than natives, with the exception of Illinois. As a share of all persons in or near poverty, immigrants and their children account for more than one-half of the poor and near poor in California and roughly one-third in New York, Florida, and Arizona. In Texas, immigrants and their children represent 27 percent of all persons in or near poverty and 29.3 percent in New Jersey.
Turning to health insurance coverage by state, Table 17 shows a similar pattern to poverty. With the exception of Illinois, immigrants and their children in every major immigrant-receiving state are significantly more likely than natives to be uninsured. The impact of immigration on the overall size of the uninsured population in some states can only be described as enormous. In California, 58.8 percent of the uninsured are immigrants or the U.S.-born children (under age 21) of an immigrant. As Table 17 shows, if immigrants and their children are not counted in California, the uninsured rate would be 13 percent — precisely the rate for natives. But, because of immigration the actual state uninsured rate is 20 percent, making it one of the highest in the country. In New York, immigrants and their children represent nearly half (47.7 percent) of the uninsured; in Florida, 39.5 percent; in Texas, 32.5 percent; in New Jersey, 34.7; in Illinois, 22.6 percent; in Massachusetts, 27.5 percent; and in Arizona, 36.4 percent.
The last two columns in Table 17 show the percentage of immigrant and native households using at least one of the major welfare programs. Not surprisingly, with the exception of Illinois, immigrant household use of welfare is higher than that of natives in every state. As a result of their higher use rates, immigrant households account for a very significant percentage of the welfare caseloads in these states. In California, immigrant households account for 42.2 percent of all households using at least one major welfare program; in New York, it’s 31.8 percent; in Florida, 26.4 percent; in Texas, 21.8 percent; in New Jersey, 23.7 percent; in Illinois, 10.2 percent; and in Arizona, immigrant households account for 26.6 of all households receiving welfare. While higher than the rate of natives in almost every state, it is important to note that there is no state in which a majority of immigrant households are on welfare.
Metropolitan Statistical Areas
Table 18 reports figures for the nation’s top-six immigrant-receiving Consolidated Metropolitan Statistical Areas (CMSA). While the Los Angles and New York CMSAs have the largest immigrant populations, the Miami CMSA ranks first in terms of the percentage of immigrants. These six metropolitan areas account for nearly 53 percent of all immigrants living in the United States but only 23.1 percent of the nation’s entire population. These six cities continue to attract a large share of new immigrants. Of immigrants who arrived in the 1990s, 48.7 percent settled in these six CMSAs.
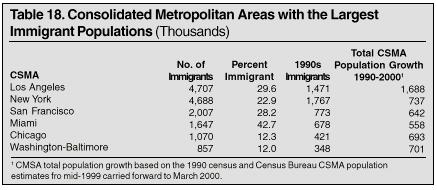
The fourth column in Table 18 reports population growth for each metro area between 1990 and 2000. All six metro areas grew significantly in population during in the 1990s. If we compare the population growth figures to the number of immigrants who arrived in the 1990s, it is clear that immigration has played a very large role in growing the population of all six metro areas. Even in the Washington-Baltimore CMSA, the number of immigrants who arrived in the 1990s (348,000) was equal to almost half of the 701,000-person increase in the area’s total population. If the 175,000 children born to immigrant parents in the Washington-Baltimore metropolitan area during the 1990s are added to the number of immigrants who arrived in the 1990s, then immigration is equal to almost 75 percent of the CMSA’s population growth.
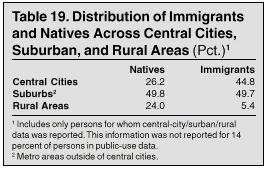
Table 19 examines the distribution of immigrants and natives between the nation’s central cities, suburban, and rural areas. With 44.8 percent of immigrants living in the nation’s central cities compared to 26.2 percent of natives, immigrants are clearly much more likely than natives to live in central cities. But contrary to the general impression, most immigrants do not live in the nation’s central cities. In fact, immigrants are just as likely as natives to live in the suburbs. As Table 19 shows, the primary difference between the two groups is that natives are much more likely to live in rural areas while immigrants are more likely to live in central cities. The large number of immigrants who live in suburban areas may be a positive sign that immigrants are successfully integrating into American society and obtaining a middle class standard of living. On the other hand, it is in suburban areas where the problems of sprawl and congestion are most acutely felt. Thus, the nearly 13 million immigrants who have settled in suburbia are likely to have contributed to these problems.
Conclusion
While immigration’s impact continues to be the subject of intense national debate, there can be no doubt that the large number of immigrants now living in the United States represents an enormous challenge. With more than half of post-1970 immigrants and their U.S.-born children living in or near poverty and one-third having no health insurance, the situation for immigrant families is clearly precarious. While the current economic expansion may tempt some to ignore these facts, when the next economic downturn occurs the costs of immigration will likely become glaringly apparent. Setting aside the lower socio-economic status of immigrants, no nation has ever attempted to incorporate more than 28 million newcomers into its society. Moreover, without a change in immigration policy, the Census Bureau projects 11 to 12 million immigrants will arrive in the next decade alone. Thus, immigration’s impact will continue to grow if current trends in immigration are allowed to continue.
End Notes
1 All persons not born in the United States, one of its outlying territories, or of U.S. parents living abroad are considered immigrants. All persons born in the United States, including the children of illegal aliens, are considered natives. The immigrant population in the CPS includes perhaps five million illegal aliens and perhaps 600,000 persons on long-term temporary visas, such as students and temporary workers. The 134,000 persons in the CPS, 15,400 of whom are immigrants, are weighted to reflect the actual size of the total U.S. population. The survey is considered such an accurate source of information on the foreign-born because, unlike the decennial census, each household in the CPS receives an in-person interview from a Census Bureau employee and the data are weighted to reflect the undercount of minorities who are often missed by surveys.
2 See Robert Warren and Ellen Percy Kraly, 1985, The Elusive Exodus: Emigration form the United States. Occasional Paper #8. Population Reference Bureau, Washington, D.C.
3 In contrast to the decennial census and the March 2000 population projection, which are the basis for the population growth figure found in Table 2, the CPS is designed to measure only the civilian non-institutionalized population. The CPS is also different because it is weighted to reflect the undercount of the non-institutionalized population, primarily minorities, that is missed by demographic surveys. Overall, these two factors tend to cancel each other out because the institutionalized immigrant population that is not included in the CPS is roughly equal in size to the undercount adjustment. This allows for direct comparisons to be made between the 1990 Census and the immigrant population in the CPS. The Census Bureau has done so in a number of recent publications. (See for example, Schmidley, 1999, pp.23-195)
4 This figures refers to persons aged 18 or older who worked full-time hours for at least part of 1999. If part-time workers are also included, then immigrants comprise 12.3 percent of the labor force.
5 There are a number of specific occupations included in the upper portion of Table 8 that do have a large concentration of immigrants, such as medical doctor. Because of the sample size, however, it is not possible to break out these occupations separately even though the effect of immigrants on these specific occupations is likely to be significant.
6 Includes only uninsured U.S.-born children whose parents arrived in the 1990s.
Steven A. Camarota, Ph.D. is the Center for Immigration Studies’ Director of Research.