Testimony Prepared for House Judiciary Committee, Subcommittee on Immigration, Border Security, and Claims
United States Congress
March 10, 2011
By Steven A. Camarota
Director of Research
Center for Immigration Studies
Despite an abysmal jobs picture, Census Bureau data collected in 2010 show that the decade just completed may have been the highest for immigration in our nation’s history, with more than 13 million new immigrants (legal and illegal) arriving. What happened during the last decade in terms of employment of native-born Americans is astounding. Even though native-born Americans accounted for the overwhelming majority of growth in the adult working-age population (18 to 65), all of the net gain in employment went to immigrants. Something like that might not be too surprising over a short period like a quarter or even a year. But it is remarkable that over a 10-year period (2000 to 2010) all the net increase in jobs went to immigrants.
- In 2008 and 2009, 2.4 million new immigrants (legal and illegal) settled in the United States, even though 8.2 million jobs were lost over the same period.1
- Immigrants come to America for many reasons. As a result, the overall level of new immigration can remain high even in the face of massive job losses.
- Immigrants accounted for just 34 percent of the growth in the working-age population (18 to 65) between 2000 and 2010, but 100 percent of the net increase in jobs went to immigrants during the entire decade.
- The growth in the native-born working-age population, coupled with their decline in the number working, created a dramatic decline in share of natives holding a job during the decades — from 76 percent in 2000 to 69 percent in 2010.
- While the share of working-age natives holding jobs fell dramatically during the decade, the share of working-age immigrants holding jobs remained roughly constant at 70 percent.
- Less-educated natives have been especially hard hit. The share of working-age native-born high school dropouts holding a job fell from 52 percent in 2000 to 41 percent in 2010. For those natives with only a high school education, the share working fell from 74 percent to 65 percent.
- A significant share of the decline in work among natives is attributable to the current recession. However, the share of natives working was declining even before the current recession began.
- If past patterns hold, employment levels will recover for the native-born, but they will not return to pre-recession levels, while those of immigrants will.
- For the native employment rate to reach the 2000 level, it would require 12 million new jobs.
Introduction
My testimony will focus on two issues, first I will discuss the extraordinary developments in the U.S. labor market over the last decade, whereby all or almost all of the net growth in jobs went to immigrants. Second, I will discuss some of the newest research showing that immigrants are displacing native-born workers, particularly less-educated workers. I will not discuss other ways immigration can impact natives, such as their potential effect on wages or benefits.
In the discussion that follows I use the words immigrant and foreign-born synonymously. Following the Census Bureau definition, immigrants or the foreign-born are persons who were not U.S. citizens at birth. This includes naturalized U.S. citizens, legal immigrants (green card holders), illegal immigrants (those in the country without authorization), and those on temporary visas. I will also use the terms native and native-born to mean persons who are U.S. citizens at birth. This includes those born in the United States, those born abroad of American parents, and persons born in outlying territories of the United States, such as Puerto Rico.
All of these individuals are included in decennial Census data and government surveys such as the Current Population Survey (CPS), which is the nation’s primary source of information on the U.S. labor force. Unless otherwise indicated, all of the data cited in my testimony is from the CPS. The figures at the end of my testimony are based on a quarterly analysis of the public-use CPS from the first quarter of 2000 to the second quarter of 2010. The CPS is extremely useful for looking at the labor force because it distinguishes immigrants and native-born Americans.
Immigrant Gains and Native Losses
The grey bars in Figure 1 report the growth in the adult working-age population — 18 to 65 years of age. The vast majority of workers in the United States fall into the 18- to 65-year-old age group. Therefore, the total 18- to 65-year-old population represents the total number of potential adult workers in the country. Figure 1 shows that the total working-age population in the United States increased by 20.4 million between the first quarter of 2000 and the second quarter of 2010. Put a different way, there were 20.4 million more potential adult workers in 2010 than in 2000. The figure also shows that immigrants accounted for 6.9 million of the increase in the number of potential adult workers, while natives accounted for 13.5 million of this increase. Thus, both the immigrant and native-born adult working-age populations grew, but the number of potential native-born workers grew twice as much as the number of potential immigrant workers.
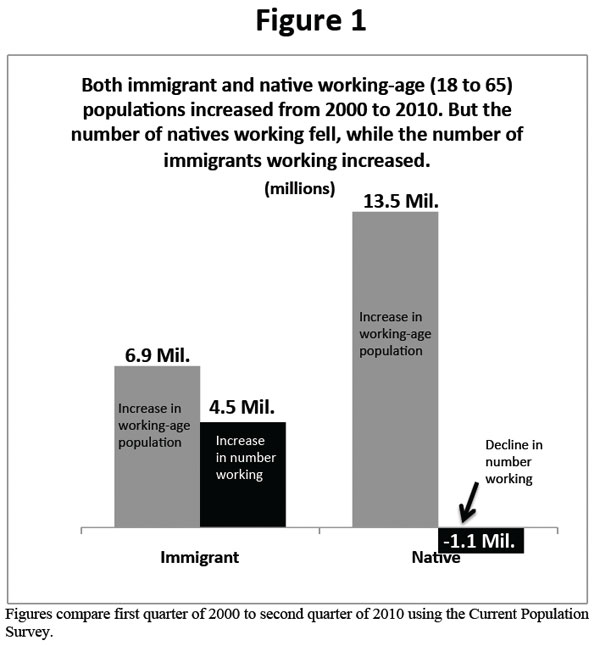
Despite natives accounting for most of the growth in the number of potential workers, Figure 1 shows that all of the net gain in employment went to immigrant workers. The black bars in the figure show the change in the number of 18- to 65-year-olds actually holding a job. The bars show that in 2010 there were 4.5 million more immigrants holding jobs than was the case in 2000. But among natives something extraordinary happened. The figure indicates that, although the number of potential native-born workers increased by 13.5 million, the number of those actually working fell by 1.1 million. This means that to the extent there was any increase in the number of people working in the United States in the last decade, all of that increase went to immigrants.2
Figure 2 shows the same basic information as Figure 1, except the trends in immigrant and native employment are represented proportionally. The grey bars in Figure 2 show the immigrant and native shares of population growth among those of working age. Thus, the 6.9 million increase in the number of working-age immigrants accounted for 34 percent of the total increase in this population. The 13.5 million increase in the size of the native-born working-age population accounted for 66 percent of the total increase in working age population. Yet Figure 2 shows that all of the net gain in employment during the decade went to immigrant workers. Since natives accounted for two-thirds of the growth in the number of potential workers, it would be expected that they would account for something like two-thirds of the increase in the number of actual workers. But this is not the case. Natives account for none of the net increase in the number of workers. Natives actually lost jobs, despite accounting for most of the net increase in the number of potential workers.
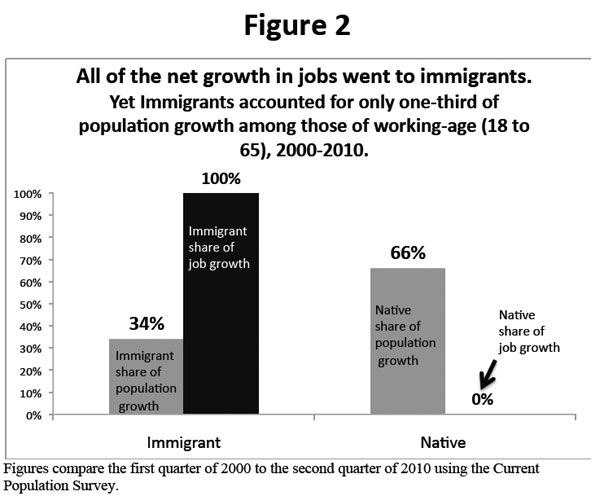
Some who do not know demography might mistakenly think that natives accounted for none of the growth in employment during the decade because the working-age (18 to 65) native-born population is not growing. But Figures 1 and 2 make clear that the working-age native population is growing significantly. In fact, numerically it is growing much faster than the foreign-born population. As we have seen, two-thirds of the increase in the number of potential workers during the past decade was among natives. But they did not get any of the net increase in jobs.
Figure 3 shows the total number of foreign-born and native-born workers in 2000 and 2010. The figure shows that from 2000 to 2010 the number of immigrants working increased from 17 million to 21.5 million — a 4.5 million increase. In contrast, the number of natives holding a job fell from 112.5 to 11.4 million — a 1.1 million decline. Taken together Figures 1, 2, and 3 have important consequences for the share of native working, which are reported in Figure 4.
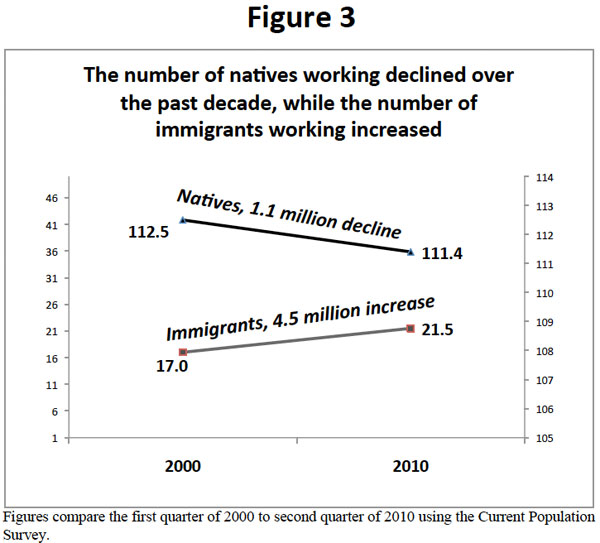
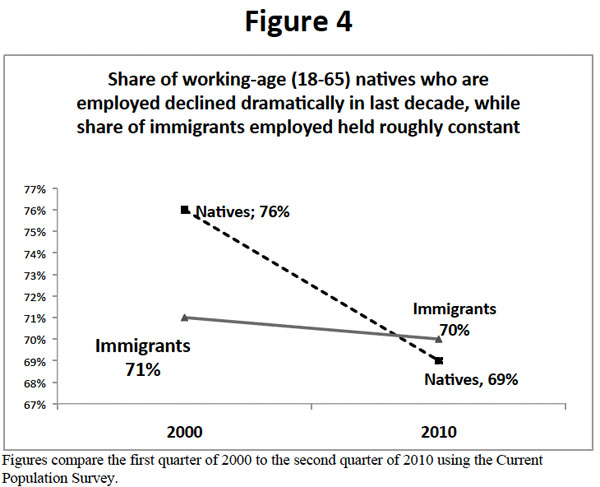
Figure 4 shows a dramatic decline in the share of adult working-age natives holding a job. In 2000, 76 percent of 18- to 65-year-old natives held a job; by the middle of 2010, it was just 69 percent. This represents a massive decline in work. In contrast, the immigrant population experienced no such decline. The share of working-age immigrants holding a job fell only slightly, from 71 to 70 percent. A much smaller fraction of natives worked in 2010 than worked in 2000. But among immigrants the share working held relatively constant. If the findings in Figure 4 were only due to the recession, natives and immigrants should have experienced roughly similar declines in work. This is not the case. For whatever reason, native employment fell dramatically while immigrant employment did not.
It should be noted that the total size of the native-born 18- to 65-year-old population averaged 155 million during the decade just completed and stood at 162 million in 2010. Thus, each 1 percent decline in the share holding a job represents roughly 1.5 to 1.6 million fewer natives working. A decline from 76 to 69 percent in the share of working age native holding a job affects at least 10 million natives. This means that if the native employment rate had held roughly constant, more than 10 million native-born workers should have been employed in 2010. This is a huge number and suggests that natives clearly lost out in the labor market during the last decade. This decline in native work can only be described as massive. But what is most striking is that there is not a parallel decline among immigrants. Their employment growth has roughly kept up with their population growth.
Is It the Recession?
There are of course many ways to look at data. When we compare 2000 to 2010, we get the results found in Figures 1 through 4. If we examine the data by year before the recession of the late-2000s, also sometimes referred to as the “Great Recession,” we get the results shown in Figure 5. The figure shows the share of population growth accounted for by immigrants and their share of job growth for each year 2000 to 2007. The Great Recession began at the end of 2007. Figure 5 shows that the share of job growth that went to immigrants was disproportionately large compared to their share of population growth in six of the eight years before the most recent recession. That is, the share of job growth that went to immigrants was larger than their share of population growth in most years before the recession. For example, immigrants accounted for 32 percent of population growth among those of working age in 2001, yet 75 percent of the net growth in jobs went to immigrants. In 2002 they were 34 percent of population growth and 98 percent of the net increase in employment for that year went to immigrants. Only in 2000 did the immigrant share of new jobs fall sharply below their share of population growth. Also, in 2003, the immigrant share of new jobs was in rough proportion to their share of job growth. In all the other years, the share of job growth that went to immigrant was much higher than their share of employment growth.
Figure 5 makes clear that immigrants gained a disproportionate share of jobs even before the current steep economic downturn that began in 2007. However, the results are not as stark as those in Figures 1 through 4. Natives did receive a disproportionately low share of jobs relative to their share of population growth, but they still gained jobs. This is an indication that the recession explains some of the startling results in Figures 1 through 4.
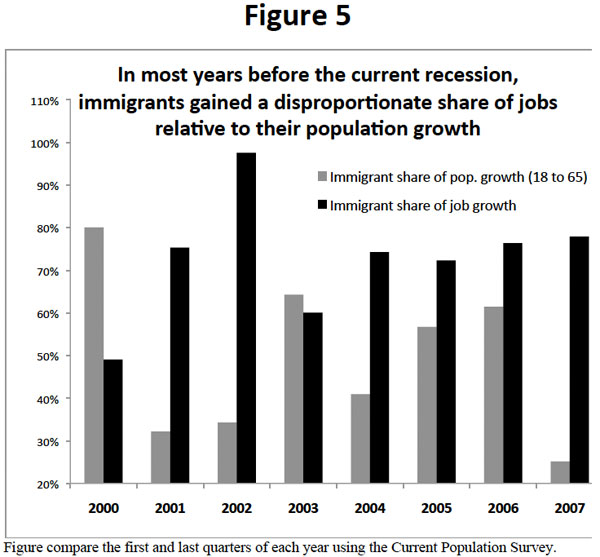
If we look at the entire period from the first quarter of 2000 to the third quarter of 2007 (the recession began in the fourth quarter of 2007), we find that 57 percent of the net growth in jobs for 18- to 65-year-olds went to immigrants, while they accounted for 40 percent of population growth. Again, a disproportionate share of jobs went to immigrants.
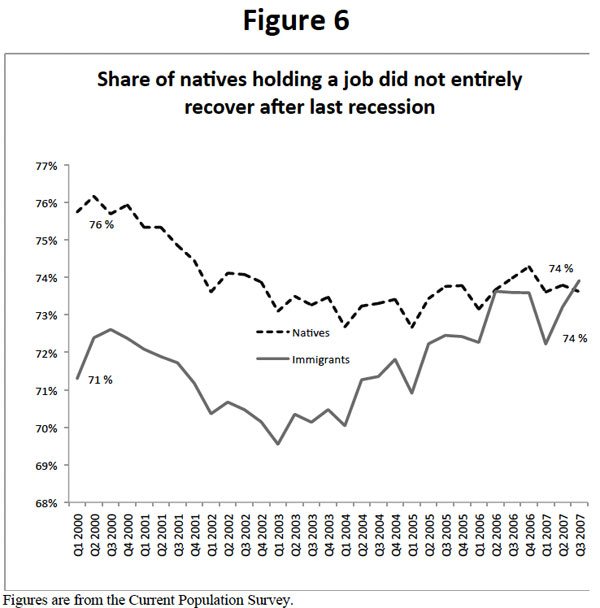
We can also look at the employment rate of natives by quarter. Figure 6 reports the share of working-age natives and immigrants holding a job for each quarter from 2000 to the third quarter of 2007, which was the peak before the Great Recession began. Employment rates are in part cyclical. They rise and fall with the economy. But what Figure 6 shows is that, as expected, the share of both immigrants and natives working declined during the 2001 recession and then there was a recovery for both groups. However, the employment rate of natives never made it back up to where it was in 2000, even when the economy recovered. For immigrants on the other hand, the employment rate was actually higher in 2006 and 2007 than it had been at the start of the decade. Native employment was two percentage points lower in 2007 than in 2000, while immigrant employment was three percentage points higher. If the same pattern holds after this recession, immigrant employment will return to pre-recession levels, while the native employment rate, when it recovers, will not make it back to where it was in 2007 during the last peak, let alone get back to 2000 levels. To make it back to the 2000 level would require a net gain of 12 million jobs just for natives. This figure does not include population growth that will occur in the future or the millions of new immigrant workers who will arrive in coming years, assuming no change in immigration policy.
Less-Educated Workers
So far we have looked at all native-born workers. But the situation is actually much worse for those with relatively little education. Adults who have not graduated high school or who have only a high school education are the ones most likely to compete for jobs with illegal immigrants. There is large body of research showing that illegal immigrants are employed at the bottom end of the labor force in occupations requiring modest levels of formal education. My own research indicates that roughly three-fourths of illegal immigrants have no education beyond high school.34
Figure 7 reports the share of working-age natives without a high school education holding a job and the same information for natives with only a high school education. These two groups together will be referred to as the “less-educated” population for the remainder of this testimony. Figure 7 shows that in 2000 the share of natives without a high school diploma holding a job declined from 2000 to 2007 by four percentage points. The share of those with only a high school education also declined by four percentage points. The third quarter of 2007 represents a peak in the post-2001 expansion. But a smaller fraction of less-educated natives were working in 2007 than in 2000. By 2010, the deterioration for both groups is dramatic. Just 41 percent of native-born high school dropouts were working. The share of natives with only a high school degree working declined from roughly three-fourths in 2000 to two-thirds by 2010. Figure 7, when compared to Figure 4, shows that less-educated natives have fared even worse in the labor market than natives generally.
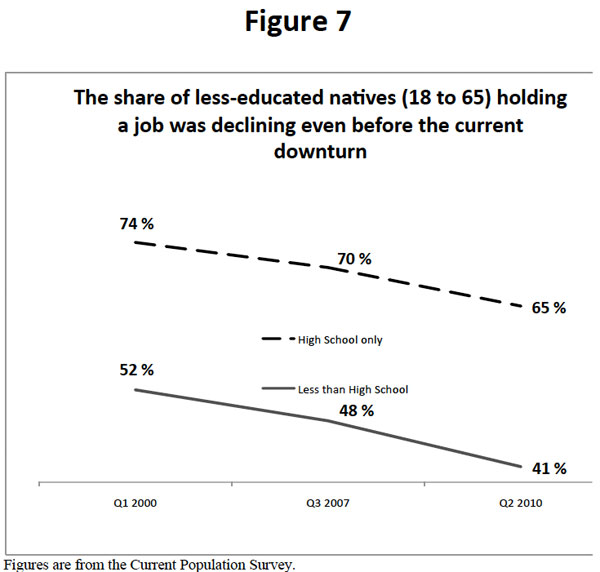
By the middle of 2010 there were 26.6 million working-age less-educated natives not employed. That is, they were unemployed or were not even in the labor force. This represents a 5.6 million increase from 2000 and a 4.6 million increase since the third quarter of 2007. It is very difficult to make the case, based on these numbers, that the country has a shortage of less-educated workers.
Teenagers (16 to 19) are another population that has fared very poorly recently. Summer has traditionally been when most teenagers worked. In a recent study we found that even before the current recession, the summer labor force participation of U.S.-born teenagers was deteriorating. Between the summers of 1994 and 2000, a period of significant economic expansion, the labor force participation of U.S.-born teens actually declined from 64 percent to 61 percent. After 2000, the summer labor force participation of U.S.-born teenagers declined from 61 percent to 48 percent by 2007. Thus, even before the current recession fewer teens were in the labor force.5
This decline in work is especially troubling for teens because there is a growing body of literature showing that those who do not work as teenagers have more difficulty working later in life. It seems that one needs to learn the skills and habits necessary to function in the world of work at a young age. Because it is more difficult to learn these skills later in life, those who do not work as teenagers are at a significant disadvantage in the labor market as they grow older.
Recent Research
There is simply no question that the first decade of this century was very bad for the employment of native-born workers, particularly the less-educated. In fact, less-educated natives had been doing poorly in the labor market for a long time. While most economists would agree that immigration has played some role in reducing wages or employment among natives, there is debate about how much immigration reduces labor market opportunities for less-educated natives. Andrew Sum and his colleagues at Northeastern University have been among those who have raised concerns about the impact of immigration on U.S.-born workers. Using multivariate statistical analysis, they found that the probability of teens and young adults (20-24) being employed was negatively affected by the number of new immigrant workers (legal and illegal) in their state. The negative impacts tended to be larger for younger workers, for in-school youth compared to out-of-school youth, and for native-born black and Hispanic males compared to their white counterparts.67
A 2010 paper by D.C. Federal Reserve economist Christopher Smith concluded that immigration has considerably reduced youth employment rates. Findings in the report indicate that immigration reduced the employment rate of native-born teenagers by seven percentage points.89
Conclusion
In this testimony I have focused on jobs. There are other possible ways of measuring the impact of immigration on native-born workers, such as looking at wages or benefits. But given the current recession, it seems appropriate to focus on employment. The trends over the last decade of immigrant employment gains and native losses are both stark and startling. First, the number of working-age adult natives increased significantly, but the number actually holding a job was lower in 2010 than in 2000. Most importantly, the share of working-age natives holding a job declined from 76 percent in 2000 to 69 percent in 2010. Second, the decline in work has been particularly pronounced for the less-educated and teenagers. The share of working-age adult natives without a high school education holding a job went from 52 percent in 2000 to 41 percent in 2010. For natives with only a high school education there was a decline from 74 percent to 65 percent over this same period. Third, immigrants fared better over the course of the decade than natives. The number holding a job increased and the share holding a job held roughly the same. Because of the divergent trends, all of the job growth in the last decade went to immigrants.
While the above facts are not in dispute, there is debate about their meaning. Did immigrants displace natives? There is certainly research indicating that immigration is adversely impacting the employment of some native-born Americans. But other factors likely matter as well. There is also no question that the current economic downturn explains some of the results discussed above. But work among native-born Americans has been in decline for some time. For example, the share of working-age adult natives without a high school education working was 48 percent in 2007 at the peak of the last expansion. This is much lower than the 54 percent in 2000 at the peak of the prior expansion. The same pattern exists for those with only a high school education. The share of less-educated natives holding a job was in decline even before the current economic downturn.
Given the abysmal labor market for American workers generally and less-educated workers in particular, it is very difficult to argue that there is shortage of workers in this country. Tolerating the presence of illegal immigrants and allowing legal immigration to run at or near record levels is difficult to justify if one is concerned about the employment of native-born Americans and legal immigrants already here.
Of course, there are many factors to consider when thinking about immigration. For example, the immigrants themselves benefit greatly by coming to our country. But it does seem clear that in the current situation, we need a national debate about whether to allow illegal immigrants to stay. We also need a debate about whether the current high level of legal immigration makes sense. My hope would be that today’s hearing will start such a debate.
End Notes
1 Arrival data are from the public-use file of the 2010 March Current Population Survey. Employment data are from the Bureau of Labor Statistics’ survey of employers.
2 It should be noted that the survey of employers that is reported by the Bureau of Labor Statistics shows no net job growth for the decade. Immigrants cannot be distinguished in the employer survey. The CPS, which is a survey of households, is the basis for the figures found in this testimony.
3 Steven A. Camarota, “Immigrants in the United States, 2007: A Profile of America's Foreign-Born Population,” Center for Immigration Studies Backgrounder, http://www.cis.org/immigrants_profile_2007.
4 Jeffrey S. Passel and D’Vera Cohn, “A Portrait of Unauthorized Immigrants in the United States,” Pew Hispanic Center, 2009, http://pewhispanic.org/files/reports/107.pdf.
5 Steven A. Camarota and Karen Jensenius, “A Drought of Summer Jobs: Immigration and the Long-Term Decline in Employment Among U.S.-Born Teenagers,” Center for Immigration Studies Backgrounder, http://www.cis.org/sites/cis.org/files/articles/2010/teen-study.pdf.
6 Andrew Sum, Paul Harrington, and Ishwar Khatiwada, “The Impact of New Immigrants on Young Native-Born Workers, 2000-2005,” Center for Immigration Studies Backgrounder, http://www.cis.org/sites/cis.org/files/articles/2006/back806.html.
7 George J. Borjas, Jeffrey Grogger, and Gordon H. Hanson, “Immigration and African-American Employment Opportunities: The Response of Wages, Employment and Incarceration to Labor Market Shocks,” Working Paper #12518, National Bureau of Economic Research, www.nber.org/papers/w12518.
8 Christopher L. Smith, “The Impact of Low-Skilled Immigration on the Youth Labor Market,” Finance and Economics Discussion Series, Divisions of Research & Statistics and Monetary Affairs, Federal Reserve Board, Washington, D.C., http://www.federalreserve.gov/Pubs/Feds/2010/201003/201003pap.pdf.
9 Steven A. Camarota and Karen Jensenius, op. cit.