Download a pdf of this Backgrounder
Steven A. Camarota is the Director of Research at the Center for Immigration Studies.
As the Gang of Eight Immigration bill (S.744) moves forward in the Senate, the employment picture remains bleak for less-skilled Americans. Yet the bill released today would give virtually all of the 11-12 million illegal immigrants in the country work authorization. Prior research indicates that at least three-fourths of illegal immigrants have no education beyond high school. Further, the bill would create a new guest worker program and expand family-based immigration for a number of years, both of which would increase the arrival of less-skill immigrants.
Among the findings of this analysis:
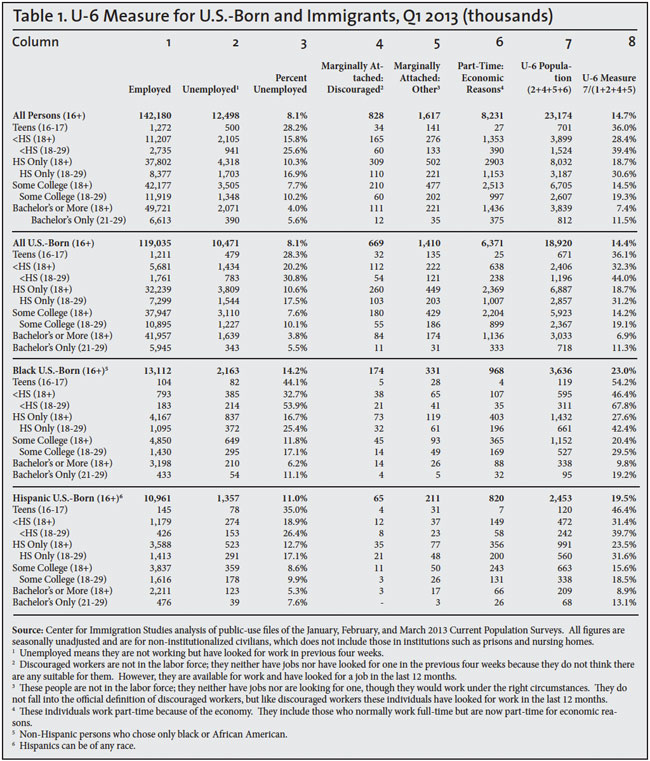
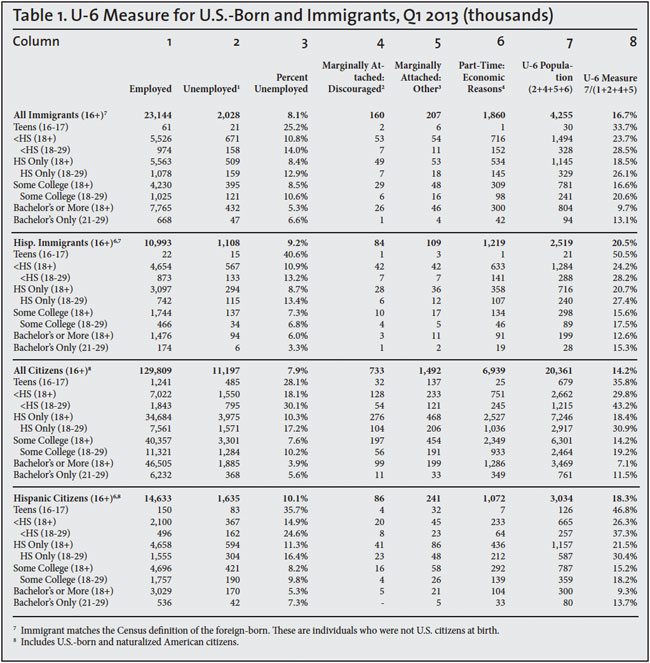
- In the first quarter of 2013 the standard measure of unemployment (referred to as U-3) showed that unemployment was 18.1 percent for American citizens (including naturalized immigrants) without a high school diploma. It was 10.3 percent for citizens with only high school education.
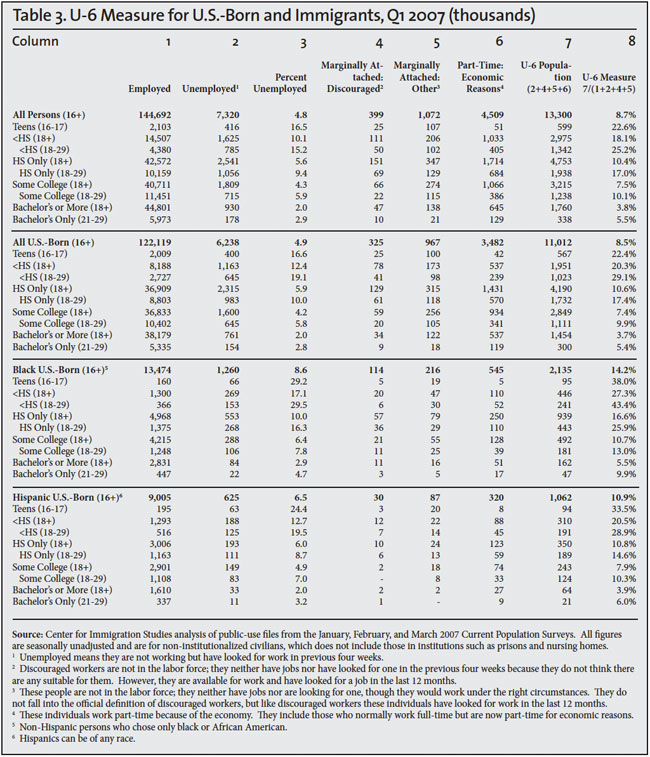
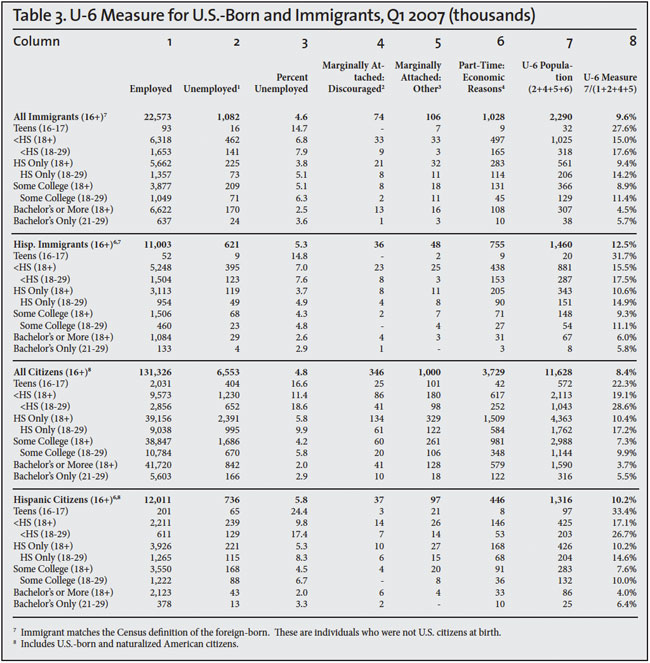
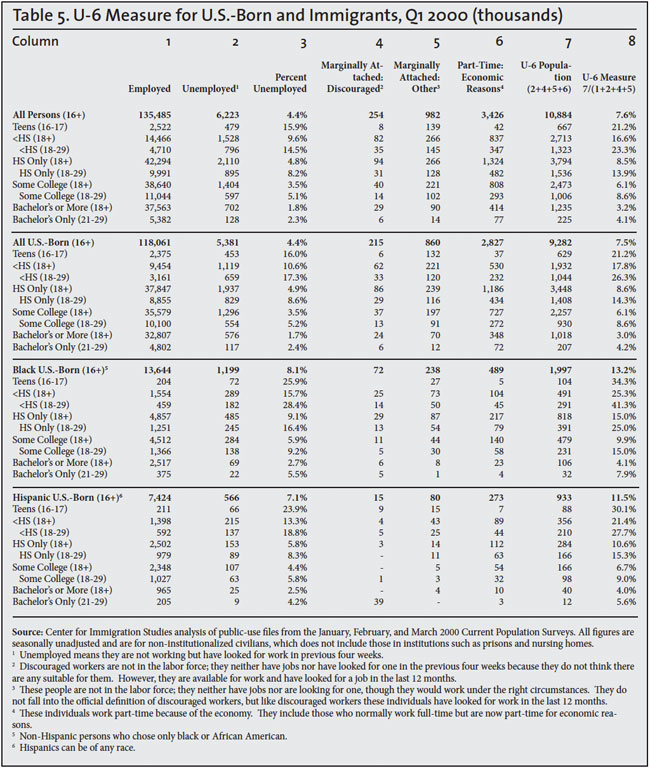
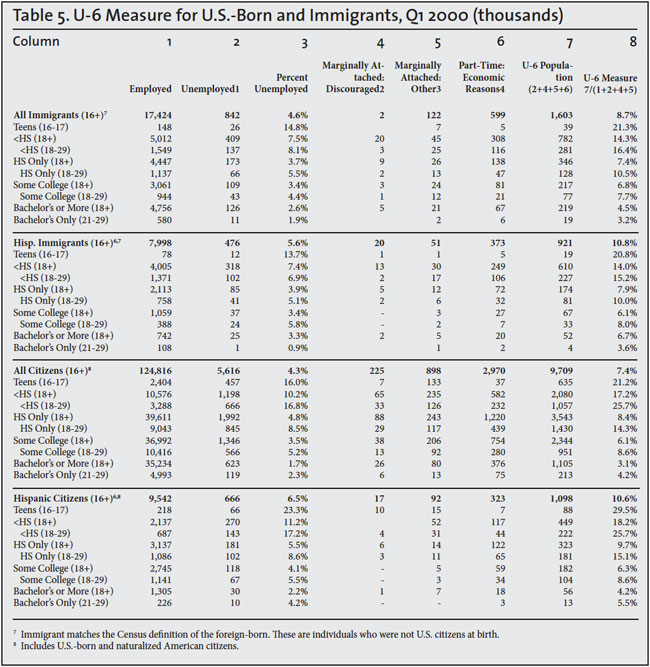
- The broader measure of unemployment (referred to as U-6) was 29.8 percent for citizens without a high school education and 18.4 percent for those with only a high school education.
- The U-6 measure includes those forced to work part-time and those who want to work, but have not looked recently.
- The figures are much worse for less-educated citizens under the age of 30.
- All of these figures represent a massive deterioration in recent years. In 2007, U-3 and U-6 unemployment for less-educated citizens was roughly 5 to 10 percentage points lower.
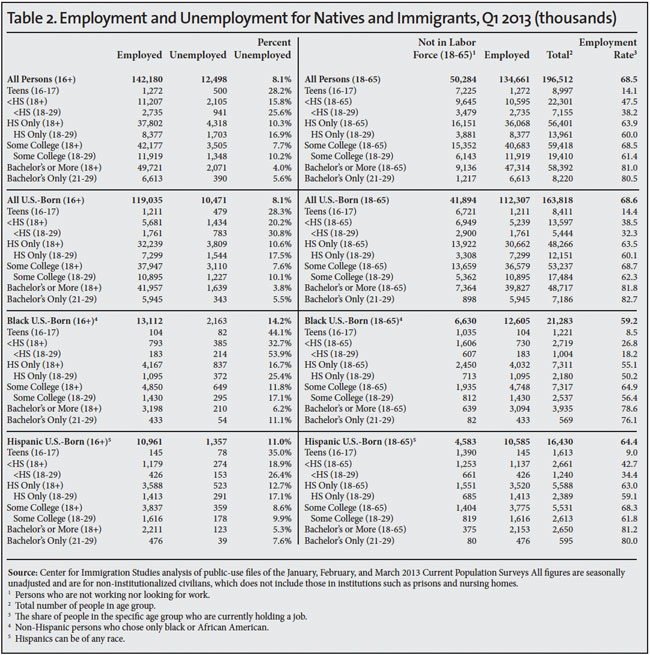
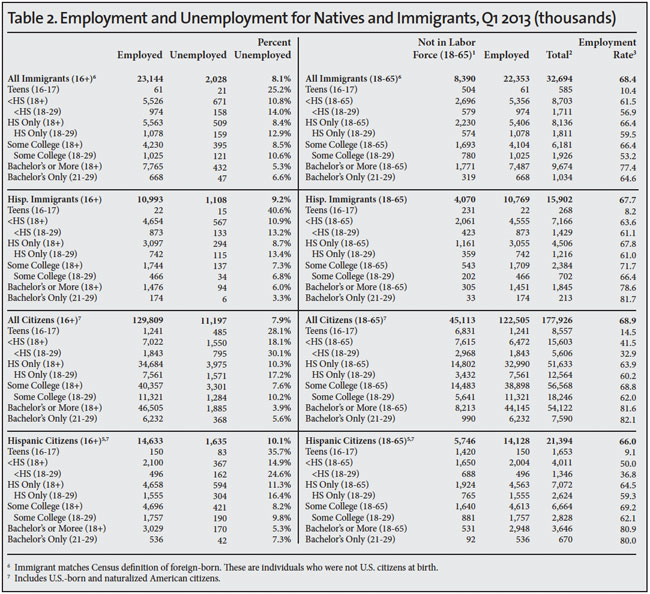
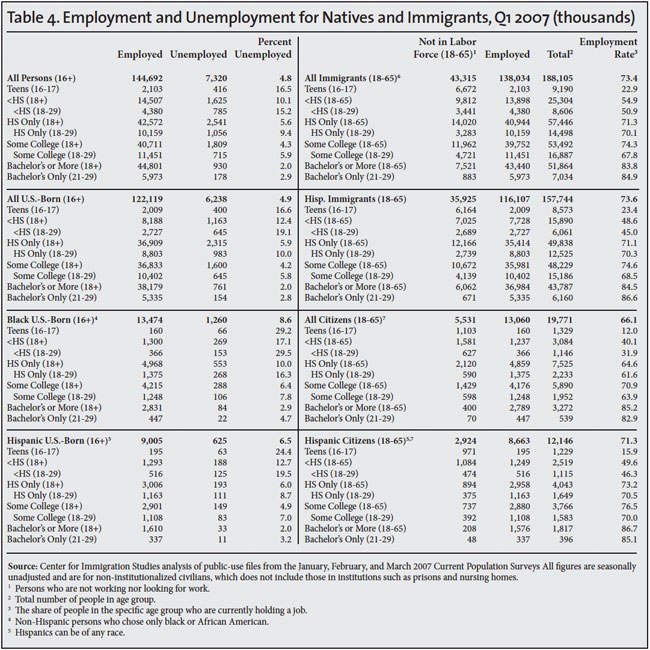
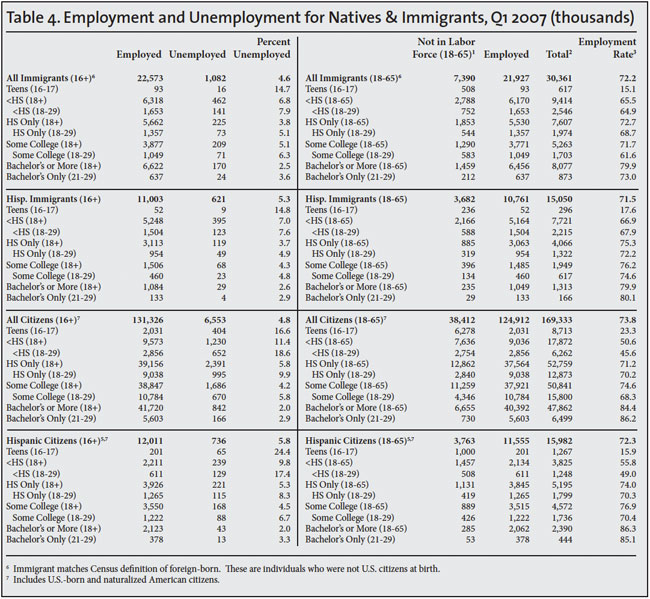
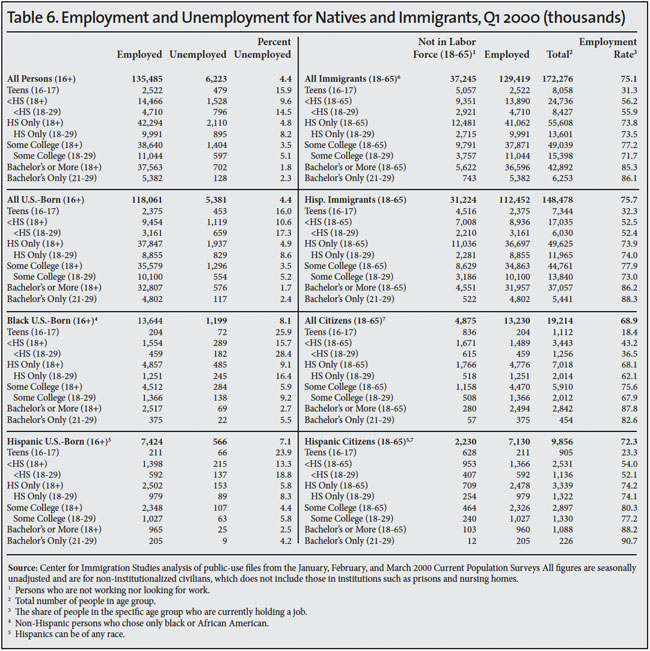
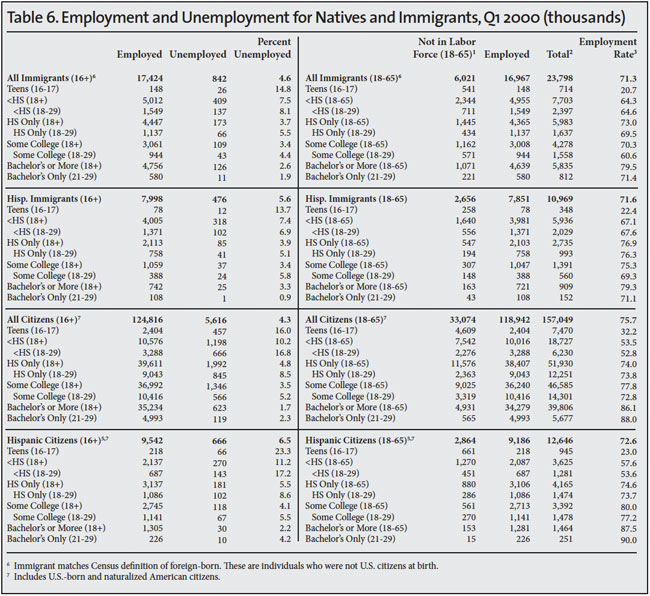
- The total number of less-educated citizens (ages 18 to 65) not working in the first quarter of this year was 27.8 million, up from 24 million in the first quarter of 2007 and 22.2 million in the first quarter of 2000. These individuals are either unemployed or out of the labor market entirely.
- In total (all education levels) there are 55.4 million adult citizens ages 18 to 65 currently not working, up from 44.4 million in the first quarter of 2007 and 38.1 million in 2000.
- More than half of working-age citizens not holding job have no more than a high school education. This is a huge pool of potential less-skilled workers.
Introduction
All of the available evidence indicates that the employment picture for those with relatively little education remains dismal. The situation is particularly dire for those under age 30 who have no more than a high school education. Prior research indicates that illegal immigrant workers are overwhelmingly those with relatively little education. While it would be a mistake to think that every job taken by an illegal immigrant is a job lost by a native, it would also be a mistake to imagine that allowing illegal immigrants to stay permanently in their jobs has no impact on labor market outcomes for U.S.-born workers. The findings in this analysis make clear that Americans with relatively little education have been hit hard by the current downturn. However, figures from 2007, which are also included, show that the employment picture was not particularly good for young and less-educated workers even before the recession started.
Findings
Unemployment (U-3 and U-6). The left side of Table 1 shows the unemployment rate for all workers using the standard U-3 measure. To be unemployed using the standard U-3 measure, one has to have looked for a job in the last four weeks. Table 1 shows that unemployment varies significantly by group. Unemployment is very high for teenagers, those without a high school diploma, and young high school graduates. One of the most important findings in Table 1 is that those citizens who are young (18 to 29) with a high school education have an unemployment rate only slightly lower than those who have not completed high school (all ages) — 17.2 percent vs. 18.1 percent.
Another important finding is that unemployment is much higher for young and less-educated U.S.-born blacks than for the population as a whole. For example, U-3 unemployment is 32.7 percent for U.S.-born blacks (all ages) who have not completed high school, much higher than for all natives without a high school education. For young blacks (18 to 29) who have completed high school, U-3 unemployment is also much higher than for all young U.S.-born workers with the same education — 25.4 percent vs. 17.5 percent.
The right side of Table 1 shows unemployment using the broader measure (referred to as U-6) that includes those who want to work, but have not looked recently, and those forced to work part-time. (The methodology section at the end of this report summarizes how U-3 and U-6 are calculated.) The broader measure of unemployment shows things are very bleak for many American citizen workers. For those without a high school education (all ages), U-6 unemployment is 29.8 percent, compared to 18.1 percent for U-3 unemployment. For young high school graduates (18 to 29), the U-6 measure is 30.9 percent, compared to 17.2 percent using the U-3 measure.
The U-6 measure shows things are also dismal for U.S.-born minorities. For U.S.-born Hispanics without a high school education, the U-6 unemployment rate is 31.4 percent. For young (18 to 29) U.S.-born Hispanic high school graduates, the U-6 unemployment rate is 31.6 percent. For U.S.-born blacks, the situation is even worse. These young and less-educated workers are the ones most likely to compete with illegal immigrants for jobs.
Not Working. The U-3 and U-6 measures both deal with those who express some interest in working. Some of those included in the U-6 measure are considered to be outside of the labor force because they have not looked for a job in the last four weeks. Thus, if someone has not looked recently for a job and has given up entirely looking for work, he or she would not be part of the U-3 or even the U-6 measure of unemployment. The right side of Table 2 reports the share of working-age adults (18 to 65) not in the labor force. It also shows the number holding a job. Table 2 shows that in first quarter of 2013, over 45 million U.S.-born citizens were not in the labor force — not working or looking for work. If we include the over 10 million U.S.-born adults (18 to 65) who are unemployed, the total number not working would be 55 million, an increase of nearly 11 million since the first quarter of 2007. The number not working has increased over 17 million since the first quarter of 2000.
There would seem to be a huge pool of legal workers available in the United States. Table 2 shows that in the first quarter of 2013, 68.9 percent of U.S. citizens of working-age were employed. This is down from 73.8 percent in the first quarter of 2007. If we returned to the 2007 employment rate, roughly 8.8 million more U.S. citizens would be working.
Conclusion
It is difficult to overstate the size of the pool of potential workers that now exists in the United States. If through enforcement a significant fraction of illegal immigrants returned to their home countries rather than being allowed to stay with legal status, there would seem to be an ample supply of idle workers to replace them, particularly workers who have relatively little education. Of course, employers might have to pay more and offer better benefits and working conditions in order to attract American citizens. But improving the living standards and bargaining power of the least-educated and poorest American workers can be seen as a desirable social outcome. The contention that there is a general labor shortage that has to be satisfied by giving work authorization and/or citizenship to illegal immigrants rather than encouraging them to return to their home countries is entirely inconsistent with the available evidence. Further, both the President and the “Gang of Eight” have proposed increasing legal immigration, including for jobs that require relatively little formal education. Again the data do not support the contention that there is a general labor shortage in the United States or a shortage of less-educated workers.
Methodology
The data for all of the tables in this study come from the public-use files of the January, February, and March 2013 Current Population Surveys (CPS) and the January, February, and March 2007 and 2000 CPSs, which are collected monthly by the Census Bureau for the Bureau of Labor Statistics (BLS). Each CPS includes about 131,000 respondents, roughly half of whom are in the labor force. The tables presented here are reported by quarter. Quarterly data are more statistically robust, especially for smaller populations like immigrants and minorities, due to the inclusion of three months of data. Persons in institutions like prisons or nursing homes are not included in the CPS. The CPS is the nation’s primary source for unemployment and other labor force statistics. Like all government surveys, the data are weighted to reflect the actual size and demographic makeup of the U.S. population.
The government publishes employment statistics that are both seasonally adjusted and unadjusted from the survey. The figures in this analysis are seasonally unadjusted. Unadjusted figures are computationally simpler and easier for other researchers to replicate. In general, BLS does not provide separate estimates for the foreign-born (immigrants) and the U.S.-born broken down by characteristics like education, race, and age. However, all CPS respondents are asked these questions. The Census Bureau defines the foreign-born as persons who are not U.S. citizens at birth, which includes naturalized citizens, legal immigrants who are not citizens (green card holders), temporary visitors and workers, and illegal immigrants. All figures for the total U.S. population (ages 16-plus) at the top of Tables 1 and 2 match those from the BLS.
Defining Unemployment. The standard measure of unemployment, referred to as U-3, takes the number of people who report that they are not working and have looked for a job in the last four weeks and divides it by the number actually working plus those looking for work. Those not actively looking for a job are not included in either the numerator or denominator when calculating the unemployment rate for U-3.
The broader measure of unemployment, referred to as U-6, is calculated differently. It divides the sum of the unemployed population, involuntary part-time workers, and marginally attached people (discouraged and other) by the civilian labor force (employed and unemployed) plus marginally attached workers. The column headings in Table 1 show this calculation. An unemployed worker is someone who does not currently hold a job, but is available to work and has looked for a job in the previous four weeks. Marginally attached workers indicate that they want and are available for jobs, and they have looked for work in the past 12 months. However, they are not considered unemployed under the U-3 definition because they have not searched for a job in the previous four weeks. Involuntary part-time workers are those individuals who report that they are working part-time for economic reasons. They want and are available for full-time work, but must instead settle for part-time hours. Because the total U-6 measure includes the unemployed, those working involuntarily part-time, and those marginally attached to the labor market (discouraged and other), it provides a broad measure of problems in the U.S. work force.