Download a pdf of this Memorandum
David North is a CIS fellow who has studied the interaction of immigration and U.S. labor markets for more than 30 years.
One of the ongoing problems with America’s immigration policy is that it is not a single, unified policy, but rather a conglomeration of various immigrant, nonimmigrant, and refugee policies, all operating quite separately. A related problem is that available statistics on these programs sometimes make it awkward to analyze the programs in question.
There are literally scores of nonimmigrant (temporary) visa categories and millions of applicants with large numbers of government officials deciding, on a case-by-case basis, who should be admitted and who should be refused. How does this part of the process work, and what does the government tell us about it?
The basic answers are, “unevenly” and “not much,” but the Center for Immigration Studies has devised an easy-to-understand index, or box score, which shows:
- issuing or denying tourist visas in non-visa-waiver countries, is, in this context, the major headache to the government;
- visas for students, short-term unskilled workers (H-2A and H-2B), and religious workers are much more troublesome to State Department officials than most other categories;
- and the least difficult grouping of them all, by a country mile, are visiting officials of the North Atlantic Treaty Organization (NATO).
While the State Department says “yes” to 3.8 tourist visa applications (outside the visa-waiver nations) for each such application it denies, it says “yes” a thunderous 191.6 times for every time it says “no” to someone claiming to be an NATO official or his or her family member. Other classes of visas fall between these 1/3.8 and 1/191.6 extremes.
The box score shows at a glance, which visa programs are causing the most difficulty for the State Department officials who actually interview aliens wanting to enter the nation as nonimmigrants.
Based on published Department of State (DoS) data, currently organized in a less useful way,1 CIS has created a table arraying 16 of the more significant nonimmigrant programs in terms of their denial/approval ratios from the most to the least troublesome.
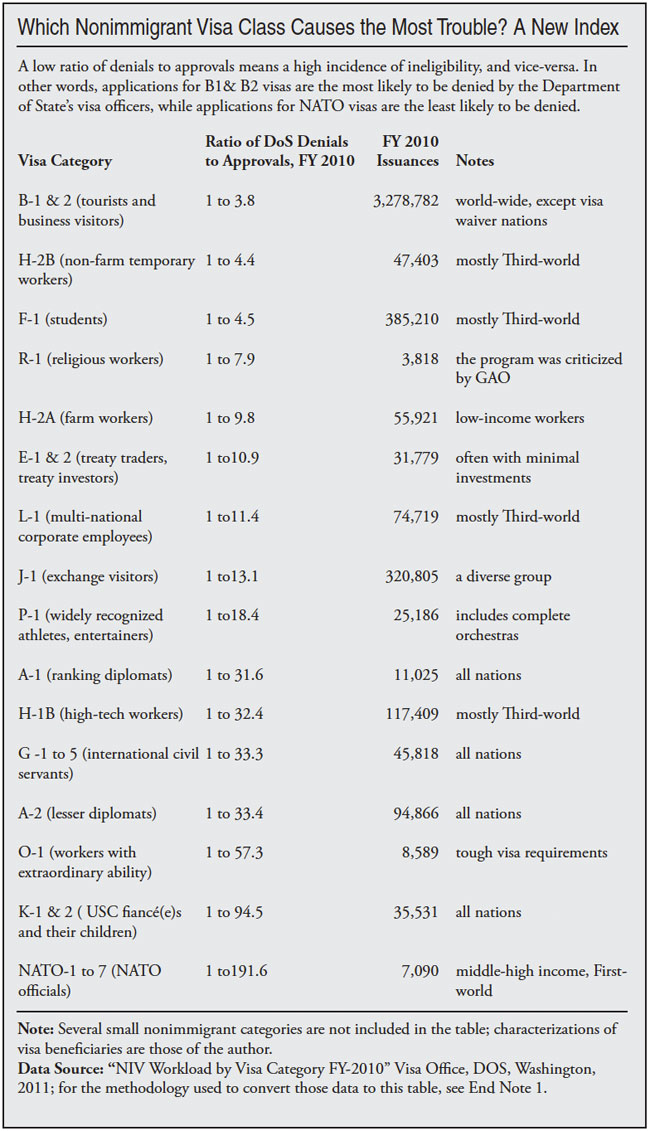
There is a 50-to-1 spread in denial/approval rates between the B-1 and the NATO categories, illustrating that some visa programs are much more vulnerable than others, at least in the eyes of our diplomats on the scene. In terms of gaining a visa fraudulently, it is much more plausible for an alien who really wants to immigrate to the United States, though he is ineligible to do so, to say that he will be a tourist than to argue, when he is not, that he is an admiral in a NATO navy.
It is always useful to quantify the differing levels of trouble within our wide range of nonimmigrant programs, which the table does.
While the nonimmigrant applicant population most likely to fail is, predictably, the would-be tourists and business visitors from non visa-waiver countries, i.e., the lower-income ones, there are some surprises within the table.
The category of nonimmigrants that is the third from the top, in terms of the ratio of denials, consists of international students. For every 4.5 approved applications in that grouping, one is denied.
Next on the list are the nonimmigrant religious workers, where the ratio is 1 to 7.9, i.e. one application rejected for each 7.9 approved. Who would think that the good guys of the community, the universities, and the churches, would attract such a high proportion of denied applicants?
I hasten to add that the religious organizations most likely to be turned down by the State Department are clearly not the mainline Protestant, Catholic, and Jewish organizations; the denials usually are related to fringe religious organizations of one kind or another. I know this from examining a secondary source within the government, not because any federal agency reports on how many applications it gets from Methodists, for instance, and how many of them are approved.2
What the new CIS table does, that I have not seen before, is to rank some of the major visa categories from the most vulnerable to the least vulnerable. It sheds a nuanced light on the apparent difficulties within these programs as seen by the officials who handle the applicants for these programs. The data, it should be stressed, do not relate to the extent of fraud and ineligibility in these programs, which cannot be known with certainty, but only to the perceived rate of fraud and ineligibility.
Let me insert a note of praise for the State Department here. Though, as described in some detail in End note 1, I find the data presentation of the department to be something less than clear, it does issue data on both the approvals and the denials of applications from aliens. USCIS, on the other hand, rarely publishes understandable data on denials, although it does publish it on approvals.
What can be learned from all the numbers in the nonimmigrant table?
First, it points to some previously obscured patterns of abuse and non-abuse within the nonimmigrant programs, and secondly, it sheds a little light on what we, as a nation, should be doing with our visa policies, on both the legislative and the administrative levels.
There would appear to be three dominant patterns in these programs: 1) the more populous the category, the higher the percentage of illicit use; 2) the higher the income of the applicants, the lower the incidence of ineligibility; and 3) to the extent that governmental entities, other than State, also screen the applications, the lower the incidence of fraud. None of these observations is particularly surprising, but I have not seen them made before in connection with nonimmigrant programs.
As to size, the most vulnerable visa programs, percentage-wise, are first, tourists, and third, students, and these categories also have the largest and the second largest number of approvals. The third-largest program, in terms of total volume, J-1 exchange visitors, is in the middle of the table.
Regarding the apparent low-income categories, at least seven of the eight at the bottom of the table (thus the least vulnerable of the programs) consist of populations with above-average incomes — diplomats, international civil servants, and high-tech workers, for example. The one possible exception consists of visas for K-1 and K-2, fiancé(e)s of U.S. citizens and those fiancé(e)s’ children, a category which has a very low rate of (detected) ineligibility. Perhaps the population of such fiancé(e)s, all of whom are betrothed to citizens, and all of whom have gone to the trouble of getting this fairly obscure visa, have above-average incomes, too.
The extremely high ratio of approvals to denials in the K-1/K-2 program at first puzzled me, given the constant presence of immigration-related marriage fraud. Perhaps the answer is that State is simply playing cupid for aliens who say they are in love, a governmental tendency that I noted previously.3
Then it struck me that those engaging in marriage fraud, though criminals, are probably rational criminals. Why go to the trouble and expense of filing a phony K-1 petition and then filing a phony petition for an alien relative (Form I-130) when you can avoid the first step entirely? If the alien who wants the illicit green card is overseas, why not use a B-1 visa to get that person into the United States? If that alien is from a visa-waiver country, no visa of any kind is needed. So the low denial rate for the K-1/K-2 category is understandable.
There is another reason for the low rate of K denials, as my colleague, Jessica Vaughan, a former Foreign Service Officer, explained to me when she reviewed an earlier version of this paper. Nonimmigrant applicants, generally, are regarded at the start of the State Department process as ineligible, and they have to prove their eligibility. On the other hand, immigrant visa applications, which have been subject to prior USCIS scrutiny, are regarded as destined for approval unless something troublesome crops up in the interview. The K application, which is the result of a petition already cleared by USCIS, is routinely treated like an immigrant visa, leading to a low denial rate.
Returning to the discussion of low-income nonimmigrant classes generally, one notices that students, unskilled temporary workers (both H-2A and H-2B), and religious workers (R-1) — all low-income categories — are in the top half of the table where ineligible applications are more likely. Again, this makes sense.
The third pattern mentioned earlier is that when another governmental agency has already pre-screened applicants in one way or another, the incidence of denials drops remarkably. When the State Department alone handles the matter, the incidence of denials is much higher.
In the eight most vulnerable programs (those in the top half of the table), four of the categories are reviewed by only the State Department; these are B-1 and B-2, F-1,4 E-1 and E-2, and J-1.
On the other hand, the bottom of the table, where problems are least like to occur, consists of eight visa categories all of which involve screening roles by other governmental agencies prior to the consular interviews. In four these categories (P-1, H-1B, O-1, and K-1/K- 2) USCIS reviews a petition back in the United States before the alien sees a consular officer; in the case of H-1B, there has been a review by both the Department of Labor and USCIS. In two instances (A-1 and A-2) a foreign government issues a document that can lead to the visa in question. In the final two (the G and the NATO classes) either an international body or a NATO nation must issue the preliminary paper. All of these screenings must help prevent fraud before the case gets to the interviewing officer.
There are, of course, some limitations to the analytical approach suggested here. In the first place, it deals only with the identified, unqualified individual applicants for specific visas. We know nothing from this source about the numbers, and the techniques, of the aliens who succeeded in outwitting the State Department, and they must be numerous.
We already know from other studies that those who come to the United States with nonimmigrant documentation, and who subsequently violate the terms of those documents, the visa abusers, constitute something like 40-45 percent of the illegal alien population. Common sense, based on the issuances of various kinds of visas, would suggest that the biggest proportion of them had arrived on tourist visas, and the second largest group (but much smaller) would be those on student visas.5
The second limitation is that none of the data in this Memorandum (and the accompanying table) have anything to say about the basic design flaws of so many of our nonimmigrant programs, such as H-1B and L-1, which have been written in such ways as to flood our labor markets with under-paid foreign workers, thus denying jobs to U.S. citizens and green card holders. No matter how carefully the State Department interviews the aliens, its officers cannot stop the influx of these congressionally-mandated, wage-depressing foreign workers when those aliens are qualified under the existing laws.
Bearing in mind these limitations, what do the numbers and ratios in the table tell us about how we might better handle our nonimmigrant programs? Can they help us think through our legislative and our administrative approach to these visas? I think so.
On the policy level, the basic lesson is that caution is needed.
Should we expand our unskilled nonimmigrant worker programs, as some business interests have argued, when some of the current programs attract such a high degree of problem applications? (See the data on the H-2B and H-2A programs in the table).
Should we ease the processing of F-1 students, as the government seems to be doing, when close to 20 percent of the current set of applicants are denied visas by the State Department?
Above all, shouldn’t we be careful when listening to the siren calls of the hospitality industry that want to give B-1 and B-2 visas to everyone in sight? Shouldn’t we avoid adding a country like Greece, with its shattered economy, to the visa waiver list, as we did in 2010?
As to the administration of these programs, we should worry about the calls for “streamlining” them. Every time another checking procedure is dropped and every time efforts are made to speed the decision-making process there is a cost — more people get visas who should not get them.
That’s the bottom line.
End Notes
1 The CIS table is organized by the incidence of ineligibility in the various visa categories; the DOS data is arrayed alphabetically. Further, as explained in more detail below, the CIS table shows a single ratio, (e.g., one denial to 3.8 approvals), while the DOS data show four categories: issuances, refusals, total applicants, and “waived/overcome,” in that order. The data source for the CIS table is a tabulation in the annual report of the Visa Office headed “NIV Workload by Visa Category” with NIV standing for nonimmigrant visa. That two-page table can be seen at http://www.travel.state.gov/pdf/FY2010NIVWorkloadbyVisaCategory.pdf.
The Visa Office tabulation, as it stands, reports on four types of actions: the filing of an application, its approval, its refusal, and, in many case, the subsequent reversal of the original refusal. As my colleague Jessica Vaughan explained to me, each of these actions takes place in a given fiscal year, but some in the “waived/overcome” category apply to refusals issued in an earlier year. In order to create a more understandable presentation, I deducted the “waived/overcome” number from that of the refusals, calling the product denials and compared that to the issuances or approvals. I then calculated a denial/approval ratio for each of the 16 visa categories.
To make the presentation more understandable I also combined all five of the international civil servant subcategories (G-1 to G-5) into a single row, as I did with all seven of the NATO subcategories. (There are subcategories for various classes of officials, and for their relatives. My favorite subcategory, which drew three applicants in FY 2010, is NATO-7; it consists of “attendants, servants, and personal employees” of people in classes NATO-1 through 6.)
Further, a number of the less significant categories were dropped completely from the CIS table, largely because of small numbers. We did not include, for instance, TN, for NAFTA workers from Canada, and to a lesser extent Mexico; there were 3,392 DOS issuances; nor did we include the U visa, in which there were 663 issuances to crime victims. The ratios for these two were one denial to 11.1 approvals, and one denial to 9.0 approvals, respectively, meaning the both categories were in the middle of the spectrum, and the number of approvals were lower than any listed in the table.
2 Clues as to what kinds of religious organizations are denied visas for R-1 religious workers can often be gleaned from the appeals from denials of these petitions, as heard by the Administrative Appeals Office (AAO), a USCIS agency. That secrecy-stricken entity does its best to hide identifying data on all cases before it, including the denominational nature of the churches involved, but often AAO’s privacy clerks fail to wipe out all useful information. Further, I know of no agency that reports statistics on the number of approvals and denials for these R-1 visas by religious grouping.
For more on this once-very-troubled visa category, see the references within my blog “What Do You Do With a Visa Program with a Fraud Rates of 30-33 Percent” at http://www.cis.org/north/R1visafraud; for the full texts of the most recently published AAO decisions on nonimmigrant R-1 petitions, see http://www.uscis.gov/portal/site/uscis/menuitem.2540a6fdd667d1d1c2e21e10....
3 See my blog, “U.S. = Stupid Cupid, U.K. = Scrooge Regarding Immigration and Marriage”, at http://www.cis.org/north/US-stupid-cupid-UK-scrooge.
4 Before the F-1 visa is issued, a would-be alien student in the United States needs to obtain a document (Form I-20) from a States-side educational institution asserting that he or she has been admitted to the institution in question. While the form is a federal form, the issuance is done by the school, and is not subject to any automatic governmental review. In many cases I-20s have been issued by educational entities subsequently revealed to be less than adequate institutions. One such institution, raided by ICE in 2011, was Tri-Valley University in Northern California as noted in this CBS News item, http://www.cbsnews.com/8301-504083_16220029013-504083.html.
5 The kind of visa used to enter the nation is not a question often asked in studies of the illegal alien population, but 35 years ago my then-colleague, Marion F. Houstoun, and I asked that question in a survey we conducted, with the cooperation of INS, of 793 apprehended illegal aliens with at least some U.S. labor market experience. We found that 70.7 percent of the aliens had entered without inspection, 21.3 percent were abusing tourist visas, 4.5 percent had a student visa at one time, and the remaining 3.6 percent had entered with a variety of other visas. North and Houstoun, The Characteristics and Role of Illegal Aliens in the U.S. Labor Market: An Exploratory Study, New TransCentury Foundation, Washington, D.C., 1976 (out of print), p. 88.