Download a pdf of this Memorandum
Steven A. Camarota is the Director of Research at the Center for Immigration Studies.
Unlike the figures published by the Department of Labor, this report provides a detailed breakdown of employment for U.S.-born and foreign-born workers by age and education. The employment situation for U.S.-born workers and citizens (foreign- and U.S.-born) remained bleak in the first quarter of 2011, particularly for the young and the less-educated, who are the most likely to compete with illegal immigrants. The findings stand in stark contrast to President Obama’s recent proposal to allow illegal immigrants to remain permanently in their jobs and to increase the number of legal immigrants allowed into the country each year. The president seems to believe that jobs are plentiful. (All figures are seasonally unadjusted.)
Among the findings:
- In the first quarter of 2011, the standard unemployment rate (referred to as U-3) for U.S.-born adults who have not completed high school was 22 percent.
- Using the broader measure of unemployment, (referred to as U-6, which includes those who want to work but have not looked recently, and those forced to work part-time), the unemployment rate for those who have not completed high school was 34.6 percent.
- The U-3 unemployment rate for young U.S.-born workers (18-29) who have only a high school education was 20.3 percent in the first quarter of 2011. Using the U-6 measure, it was 34.4 percent.
- The U-3 rate for U.S.-born, young (18 to 29) adults who have completed some college, but do not have a bachelor’s degree was 11.3 percent. Using the U-6 measure, it was 20.2 percent.
- Those with a bachelor’s degree have generally been more insulated from recessions than other workers, and to some extent this is still true. But for young (21 to 29) college graduates, the U-6 measure was 12.2 percent in the first quarter of 2011.
- In most cases, unemployment for young, U.S.-born workers is double or nearly double what it was in the first quarter of 2007, before the recession began.
- The number of U.S.-born working-age adults (18 to 65) not working was 51.7 million in the first quarter of 2011. This is up 10.1 million compared to the first quarter of 2007, before the recession began.
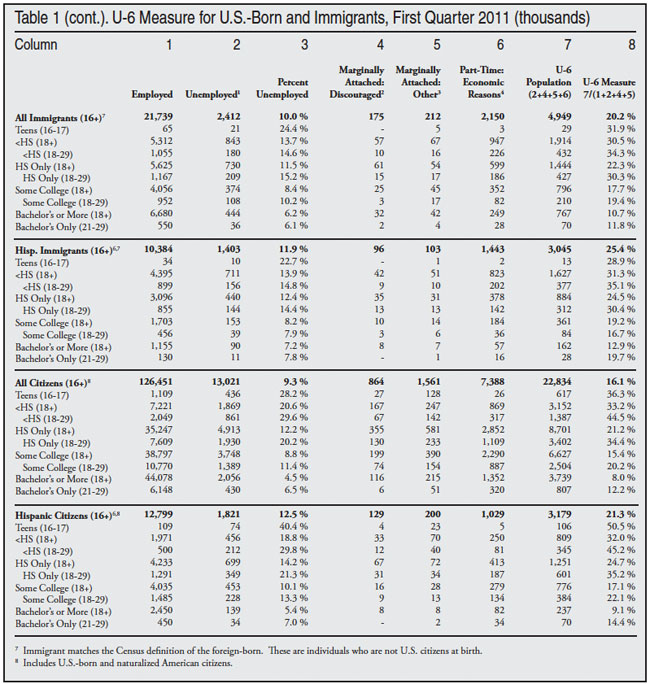
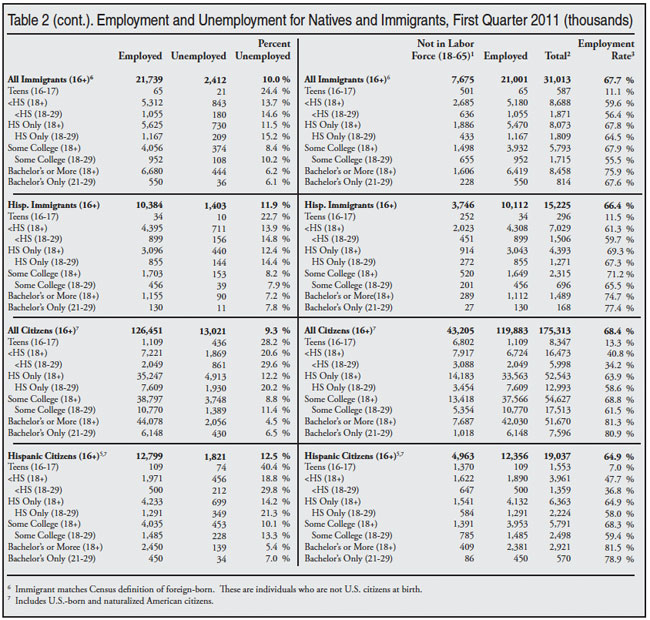
- If we consider all American citizens (U.S.-born and naturalized), the number of working-age adults not holding a job was 55.4 million.
- More than half (28.7 million) of working-age citizens not holding a job have no education beyond high school. This is a huge pool of potential lower-skilled workers.
Introduction
In his May 10th speech in El Paso, President Obama outlined his vision for reforming the nation’s immigration system. He argued that because the border is more secure, it is now time to legalize illegal immigrants and to increase the number of legal immigrants allowed into the country in the future. Like the U.S. Chamber of Commerce and other advocates for such policies, the president argues that illegal immigrants need to stay in their jobs and more immigrant workers need to be admitted each year. Unlike the Chamber, which explicitly argues that more workers are needed, the president emphasized that amnesty and more legal immigration are needed for humanitarian reasons. He argued that enforcing immigration laws and limiting legal immigration separates families and is unfair. While they each emphasized different justifications, the president’s position and that of the Chamber would result in the same outcome — illegal workers would stay and more foreign workers would be allowed into the country.
The president’s speech seems to assume that jobs are plentiful. But all the available evidence indicates this is not the case, particularly for the young and less-educated, who are the most likely to compete with illegal immigrants. Prior research indicates that illegal immigrant workers are overwhelming those with relatively little education.1 While it would be a mistake to think that every job taken by an immigrant is a job lost by a native, it would also be a mistake to imagine that allowing illegal immigrants to stay permanently in their jobs and increasing immigration further has no impact on labor market outcomes for U.S.-born workers.
The findings in this analysis make clear that Americans with relatively little education have been very hard hit by the current downturn. Moreover, the president argued that anyone who completes college in the United States should be allowed to stay permanently. But again, this position ignores the difficult employment situation for young college graduates.
Unemployment (U-3 & U-6). The left side of Table 1 shows the unemployment rate for all workers using the standard U-3 measure. To be unemployed using the standard U-3 measure, one has to have looked for a job in the last four weeks. Table 1 shows that unemployment varies significantly by group. Unemployment is very high for teenagers, those without a high school diploma, and young high school graduates. One of the most important findings in Table 1 is that those who are young (18 to 29) with a high school education have an unemployment rate similar to those who have not completed high school (all ages) — 22 vs. 20.3 percent.
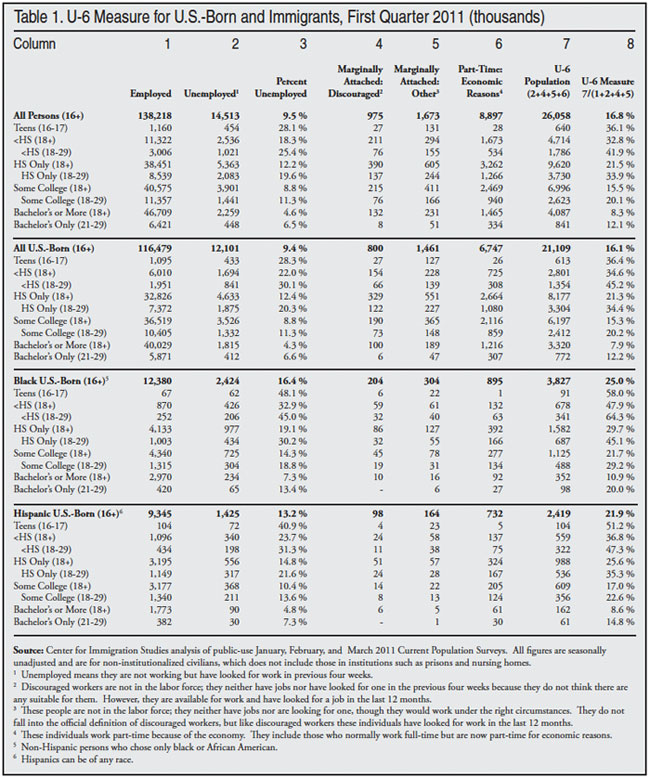
Another important finding is that unemployment is much higher for young and less-educated U.S.-born minorities than for the population as a whole. For example, U-3 unemployment is 32.9 percent for U.S.-born blacks (all ages) who have not completed high school, much higher than for all natives without a high school education. For young blacks (18 to 29) who have completed high school, unemployment is also much higher than for all young U.S.-born workers with the same education. Unemployment for U.S.-born Hispanics also is somewhat higher than for all U.S.-born workers with the same education.
The right side of Table 1 shows unemployment using the broader measure, (referred to as U-6) that includes those who want to work, but have not looked recently, and those forced to work part-time. (The methodology section at the end of this report summarizes how U-3 and U-6 are calculated.) The broader measure of unemployment shows things are very bleak for American workers. For those without a high school education (all ages), U-6 unemployment is 45.2 percent, compared to 22 percent for U-3 unemployment. For young high school graduates, the U-6 measure is 34.4 percent compared to 20.3 percent using the U-3 measure. The U-6 measure shows things are very bad for U.S.-born minorities. For U.S.-born Hispanics without a high school education and young high school graduates the U-6 unemployment rate is more than 35 percent for both groups. For U.S.-born blacks the situation is even worse. These young and less-educated workers are the ones most likely to compete with illegal immigrants for jobs. And they are the ones most likely to benefit from having fewer illegal immigrants in the country.
Not Working. The U-3 and U-6 measures both deal with those who express some interest in working. Some of those included in the U-6 measure are considered to be outside of the labor force because they have not looked for a job in the last four weeks. Thus if someone has not looked recently for a job and has given up entirely looking for work, then he or she would not be part of the U-3 or even the U-6 measure of unemployment. The right side of Table 2 reports the share of working-age adults (18 to 65) not in the labor force. It also shows the number holding a job. Table 2 shows that in first quarter of 2011, nearly 40.4 million U.S.-born adults were not in the labor force — not working or looking for work. If we include the 11.3 million U.S.-born adults (18 to 65) who are unemployed, the total number not working would be 51.7 million, an increase of 10.1 million since the first quarter of 2007.
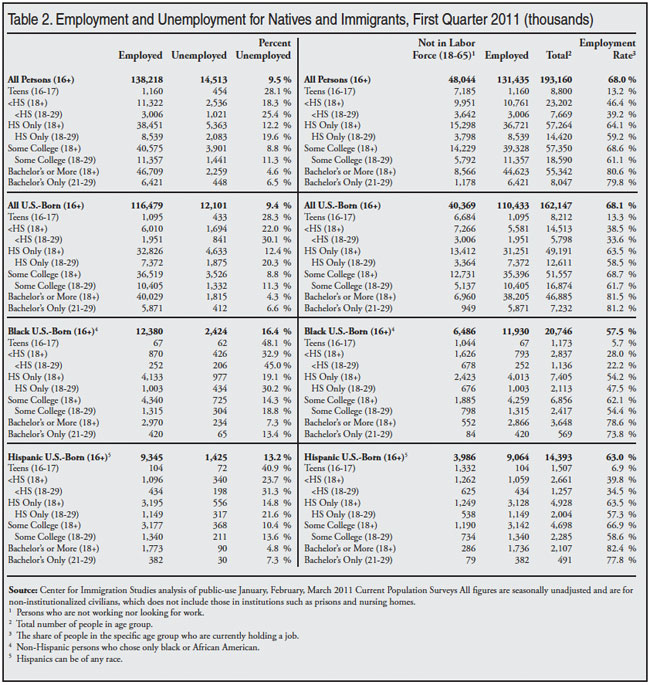
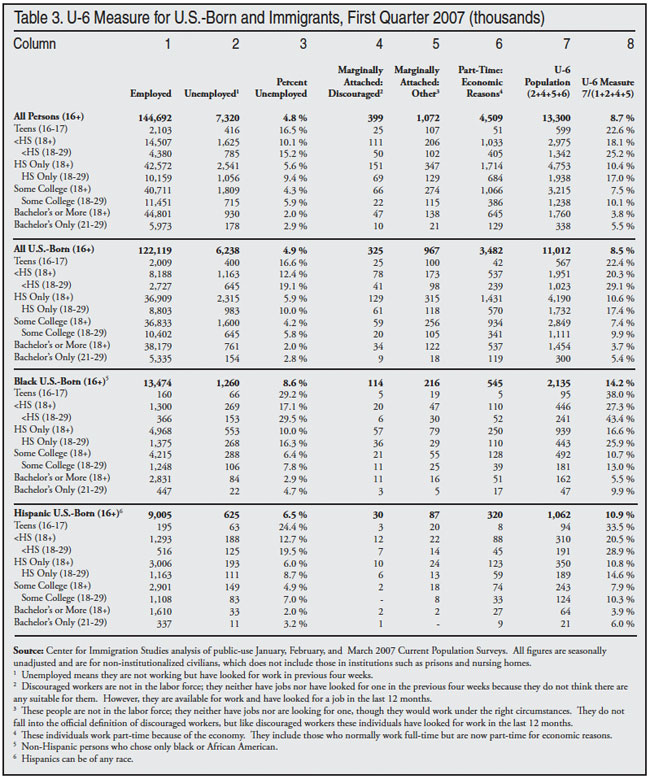
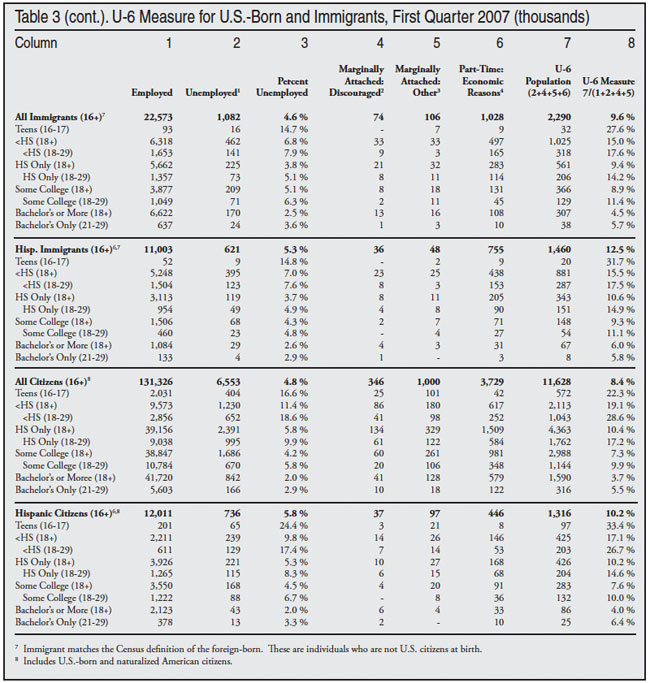
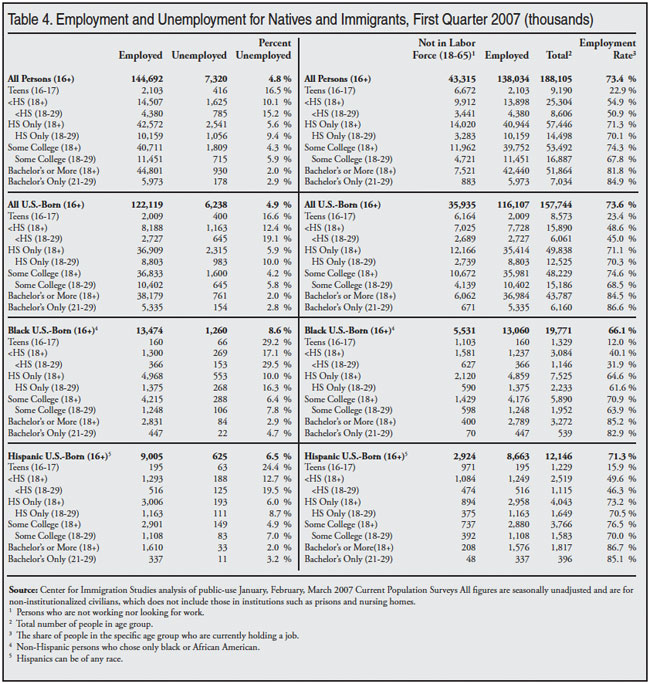
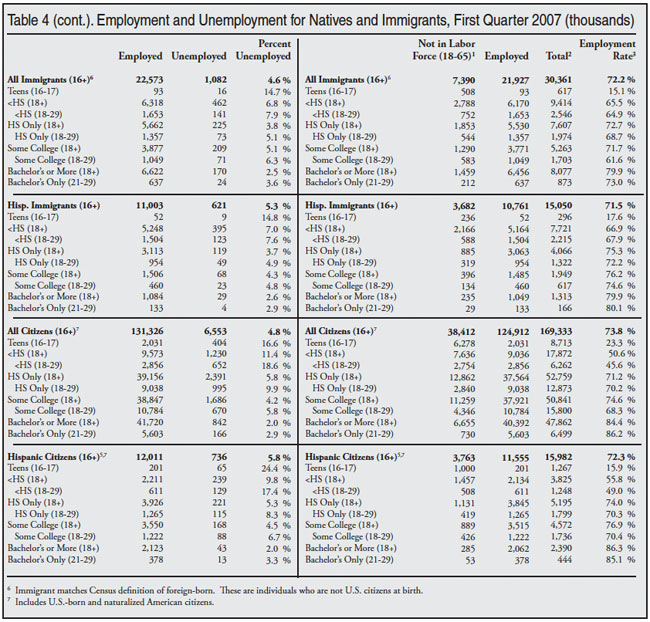
We can see the increase in the number not working by comparing Table 2 to Table 4. Table 4 shows the same information as Table 2 except that it is for the first quarter of 2007, before the recession began. (Table 3 (pp. 10-11) shows the same information as Table 1 for the first quarter of 2007.) There would seem to be a huge pool of legal workers available in the United States. Table 4 shows that in the first quarter of 2007, 73.6 percent of U.S.-born working-age adults were employed. In 2011 it was 68.1 percent. If we returned to the 2007 employment rate, roughly 10 million more U.S.-born adults would be working.
Conclusion
It is difficult to overstate the size of the pool of potential workers that now exists in the United States. If through enforcement a large fraction of illegal immigrants returned to their home countries, there would seem to be an ample supply of idle workers to replace them, particularly workers who have relatively little education. Of course, employers might have to pay more, and offer better benefits and working conditions in order to attract American citizens. But improving the living standards and bargaining power of the least-educated and poorest American workers can be seen as a desirable social outcome. The contention that there is a general labor shortage that has to be satisfied by increasing the number of immigrants allowed into the country seems entirely inconsistent with the available evidence.
Methodology
The data for all of the tables in this study come from the public-use files of the January, February, and March 2011 and 2007 Current Population Surveys (CPS), which are collected monthly by the Census Bureau for the Bureau of Labor Statistics (BLS). Each CPS includes about 131,000 respondents, roughly half of whom are in the labor force. The tables presented here are reported by quarter. Quarterly data are more statistically robust, especially for smaller populations like immigrants and minorities, due to the inclusion of three months of data. Persons in institutions like prisons or nursing homes are not included in the CPS. The CPS is the nation’s primary source for unemployment and other labor force statistics. Like all government surveys, the data are weighted to reflect the actual size and demographic makeup of the U.S. population.
The government publishes employment statistics that are both seasonally adjusted and unadjusted from the survey. The figures in this analysis are seasonally unadjusted. Unadjusted figures are computationally simpler and easier for other researchers to replicate. In general, BLS does not provide separate estimates for the foreign-born (immigrants) and the native-born broken down by characteristics like education, race, and age. However, all CPS respondents are asked these questions. The Census Bureau defines the foreign-born as persons who are not U.S. citizens at birth, which includes naturalized citizens, legal immigrants who are not citizens (green card holders), temporary visitors and workers, and illegal immigrants. All figures for the total U.S. population (age 16+) at the top of Tables 1 and 2 match those from the BLS.
Defining Unemployment. The standard measure of unemployment, referred to as U-3, takes the number of people who report that they are not working and have looked for a job in the last four weeks and divides it by the number actually working plus those looking. Those not actively looking for a job are not included in either the numerator or denominator when calculating the unemployment rate for U-3.
The broader measure of unemployment referred to as U-6 is calculated differently. It divides the sum of the unemployed population, involuntary part-time workers, and marginally attached people (discouraged and other) by the civilian labor force (employed and unemployed) plus marginally attached workers. The column headings in Tables 1 and 3 show this calculation. An unemployed worker is someone who does not currently hold a job, but is available to work and has looked for a job in the previous four weeks. Marginally attached workers indicate that they want and are available for jobs, and they have looked for work in the past 12 months.2 However, they are not considered unemployed because they have not searched for a job in the previous four weeks. Involuntary part-time workers are those individuals who report that they are working part-time for economic reasons. They want and are available for full-time work, but must instead settle for part-time hours.3 Because the total U-6 measure includes the unemployed, those working involuntarily part-time, and those marginally attached to the labor market (discouraged and other), it provides a broad measure of problems in the U.S. work force.
End Notes
1 The Pew Hispanic Center has estimated that 74 percent of illegal immigrants 25 to 64 have no more than a high school education and 46 percent of legal immigrants in the same age group also have no education beyond high school. See Figure 16 in “A Portrait of Unauthorized Immigrants in the United States,” at http://pewhispanic.org/files/reports/107.pdf.
2 Marginally attached workers indicate that they looked for work in the last 12 months, but not in the prior four weeks. The marginally attached are comprised of two groups, both of which are included in U-6. One group is considered “discouraged.” (The variable in the CPS used to determine this population is pemlr). Discouraged workers provide a reason related to the market conditions for why they are not currently looking for a job. The second group of marginally attached workers indicate that they are conditionally interested in finding work and are referred to as “other marginally attached workers.” (The variable in the CPS used to determine this population is prdisc). These individuals provide reasons such as family responsibilities, school attendance, illness, and transportation problems for why they have not searched for work in the previous four weeks.
3 Involuntary part-time workers respond that they are working part-time (one to 34 hours a week) for economic reasons, and this includes those who usually work full-time and those who usually work part-time. They share a desire to work full-time.