Download a pdf of this Memorandum
Steven A. Camarota is the Director of Research and Ashley M. Webster is a demographer at the Center for Immigration Studies.
Some commentators have argued that the failure of Congress to pass “comprehensive immigration reform,” coupled with Arizona’s new enforcement efforts, will increase Hispanic turnout in the upcoming midterm elections. More recently, others have argued that these same issues will dampen Hispanic turnout. This Memorandum provides a means for evaluating these arguments by examining the Hispanic voting trends in past midterm elections and projecting what their turnout might be next week based on data from the Census Bureau. Once the election is over, the extent to which Hispanic turnout follows or deviates from past patterns can be used to evaluate if this was an unusual election with regard to Hispanics.
Among the findings:
- On average, 31.8 percent of Hispanic citizens (18+) voted in the 2002 and 2006 midterm elections, compared to 48 percent of non-Hispanic whites and 42 percent of non-Hispanic blacks.
- The extent to which Hispanics differ from the historical average (31.8 percent ± 1.7), will be an indication of how energized they were in 2010.
- Polling of Hispanics indicates that immigration is not one of their most important issues.
- Only 28.2 percent of Hispanic voters in the 2008 election were immigrants (naturalized U.S. citizens).
- The lack of direct personal experience with immigration may explain why the issue does not rank higher in importance to Hispanic voters.
- Based on past patterns, we project that Hispanics will comprise 6.8 percent of the electorate in November 2010. This is a reduction from 7.4 percent in the 2008 presidential election, but is an increase from 5.8 percent in the last off-year election in 2006.
- The Hispanic share of the overall vote in 2010 is a more indirect measure of their enthusiasm because it partly depends on turnout among other groups. If Hispanic participation is average, but participation among non-Hispanic is above average, then the Hispanic share of the vote will be smaller even though their turnout was not unusually low.
- We project that Hispanics in November 2010 will comprise 14 percent of the total adult (18+) population and 9.3 percent of the adult citizen population.
- Hispanics comprise a much smaller percentage of voters than they do of the overall adult population because a large share (37.7 percent) of adult Hispanics are not citizens. Also Hispanic citizens register and vote at somewhat lower rates than other groups.
Methods and Data
The data for this analysis come from the Voting and Registration Supplement of the Current Population Survey (CPS) collected by Census Bureau, which contains about 100,000 adults. The Voting and Registration supplement is conducted in November every other year after Election Day. Among other questions, the survey asks individuals if they are registered to vote and if they voted. This analysis focuses on Hispanics. Hispanics are individuals in the CPS who self-identify as Hispanic or Latino, which means that they or their ancestors came from a country that derives its language and culture from Spain.
The Hispanic Vote in 2010
There has been a lot of debate about the Hispanic vote in the upcoming 2010 midterm elections. Some have speculated that Hispanics will be particularly animated this election and will turn out in large numbers. This line of argument generally assumes that the heightened visibility of new enforcement efforts in Arizona and elsewhere, coupled with the failure of Congress to pass an amnesty for illegal immigrants, will cause Hispanics to turn out in large numbers to express their dissatisfaction. America’s Voice, a far-left immigration advocacy group, recently cited a poll by Latino Decisions showing that, after the failure of the Dream Act, Latino voters have become more likely to vote.1 But many observers have expressed concern that Hispanic turnout will be low. Erin Pangilinan, a prominent blogger for the progressive website Change.org, suggests that Democrats should be worried about midterm elections given a large Latino voter block that has the potential to decide the outcome in many swing states that helped carry Obama in the 2008 Presidential election.2 Miami Herald columnist Andres Oppenheimer has argued that, “The projected turnout among Hispanics is not high: There is disappointment in the Obama administration, and disillusionment with the economy.”3
Simon Rosenberg, president of the New Democrat Network, a center-left think tank, thinks that “the Latino vote in 2010 will still be overwhelmingly Democratic, but it will be a smaller share of the electorate than in the last two elections.”4 The New York Times, citing a Pew Research Center for the People & the Press poll argued that Latino turnout is likely to lag given that only 51 percent of Latino registered voters said they would absolutely go to the polls, compared with 70 percent of all registered voters.5
Of course, we will have to wait until after the election to determine who is correct. The only way to determine if Hispanics were particularly apathetic or particularly animated this election cycle is to compare 2010 to other recent midterm elections once the election is over. The purpose of this analysis is to establish a baseline of past patterns in recent elections so we can see if the upcoming election is different.
Hispanic Turnout in Past Elections
Turnout by Eligible Voters. Figure 1 reports the share of voting-age Hispanic citizens who voted in the last five elections. It shows that there has been a general increase in the share of eligible Hispanics who vote. This increase is more pronounced in presidential elections, however, not off-year elections. On average, 31.8 percent of eligible Hispanics voted in the last two midterm elections. This is a significantly lower turnout than for non-Hispanic whites and black voters. Participation rates of eligible voters offer one of the best ways to judge if this election is different from past elections. The margin of error for the Hispanic vote share is 1.7 percentage points using a 90 percent confidence level. Thus, if the share of Hispanic citizens who vote in 2010 is above 35.3 percent it would be an indication their turnout was higher than in the last two midterm elections and they were particularly engaged this election. Conversely, if their turnout is less than 30.1 percent it would be an indication that they were especially unmotivated this election cycle.

A mentioned above, a Pew Research Center for the People & the Press poll found that 51 percent of Hispanic registered voters say they are absolutely certain to vote. This compares to 70 percent for all registered voters.6 In the last two midterm elections, 60 percent of registered Hispanics actually voted (58.7 percent in 2002 and 60.1 percent in 2006). In contrast, 61.5 percent and 61.9 percent of non-Hispanic registered voters turned out in 2002 and 2006. Thus, registered Hispanic voters are only slightly less likely to vote than non-Hispanics. The Pew poll may be an indication that Hispanics are less engaged this election. Unfortunately the same survey was not taken prior to past midterm elections so it is difficult to judge if this year will actually be a year with low Hispanic turnout. Or, more accurately, an election in which Hispanic turnout is lower relative to turnout in recent midterm elections.
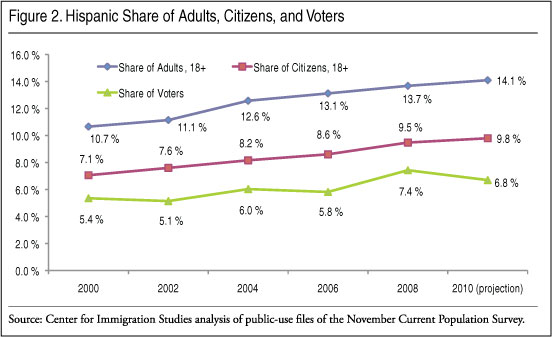
Hispanic Share of the Vote. Figure 2 shows the share of the U.S. population that is Hispanic and 18 and older from 2000 to 2008. It also shows their share of voting-age citizens and their share of those who voted in past elections. Figure 2 projects their share of the adult population, their share of the adult citizen population, and the share who will vote in 2010 based on past patterns in midterm elections.7 We project that Hispanics will comprise 6.8 percent of the electorate in November 2010. This is a reduction from 7.4 percent in the 2008 presidential election, but an increase from 5.8 percent in the last off-year election in 2006. The Hispanic share of the overall vote in 2010 is a more indirect measure of their enthusiasm than is the voter participation rate of citizens. Their share of the vote partly depends on turnout among non-Hispanics. For example, if Hispanic participation is average, but participation among non-Hispanics is above average, then the Hispanic share of the vote will be smaller, even though the share of Hispanic citizens who voted was not unusually low. Our projections assume average levels of registration and voting among both Hispanics and non-Hispanics.
The Immigration Issue. The Pew Research Center for the People & the Press poll cited above found that Hispanic voters ranked immigration fifth in importance after education, jobs, healthcare, and the federal deficit. As Mark Lopez of the Hispanic Center points out: “Immigration does not rank as a top voting issue for Hispanics.”8 A Zogby poll from February of this year found that when asked if they favored enforcement and illegal immigrants going home or putting illegals on a path to citizenship, 52 percent of Hispanic likely voters favored enforcement, and just 32 percent favored citizenship.9 The fact that immigration is not a top issue for Hispanics and that pro-enforcement views are common defies the stereotypes of this population. This does not mean that immigration is completely unimportant to Hispanics. The Zogby poll found that Hispanics are more favorable toward amnesty for illegal immigrants than is the general public. What these results do mean is that other issues matter more than immigration and Hispanic views on the issue do not fit the stereotype often ascribed to them.
This is not surprising when one considers that only 28.2 percent of Hispanic voters in the 2008 election were immigrants themselves. The overwhelming majority of Hispanic voters were born in this country. Second, in 2008, only 14.3 of Hispanic voters lived in the same household as a non-citizen.10 It is the non-citizen population that has the most direct interest in changing the nation’s immigration system because it includes illegal immigrants and others on temporary visas who might like to stay permanently, but cannot do so under the current system. In the Current Population Survey, about half of non-citizens are illegal immigrants. The large share of Hispanic voters who do not have a direct personal experience with immigration may help explain why the issue often ranks relatively low in importance for this population.
Conclusion
This report establishes a baseline for judging how engaged Hispanics will be this election cycle. Prior voting trends indicate that about one-third of eligible Hispanic voters participate in midterm elections. The extent to which the Hispanic vote differs from the expected pattern can be taken as an indication of how engaged they are this election cycle. Although immigration is of concern to Hispanic voters, prior research indicates that it is not one of their top concerns. It must be remembered that the vast majority of Hispanic voters are not immigrants themselves. Thus, it seems unlikely that this issue by itself will cause Hispanic turnout to be particularly high or low in the election next week. Once data are available from the November 2010 CPS, however, this question will be answered.
End Notes
1 http://americasvoiceonline.com/blog/entry/experts_analyze_latino_voters_....
2 http://immigration.change.org/blog/view/immigrant_voter_blocks_could_cos....
3 “Low Hispanic turnout may hurt Dems,” Miami Herald, August 5, 2010, http://www.miamiherald.com/2010/08/05/1761929/low-hispanic-turnout-may-h....
4 Quoted in the Pueblo Chieftain, http://www.chieftain.com/opinion/ideas/article_727b0eb6-b881-11df-aad3-0....
5 http://www.nytimes.com/2010/10/06/us/politics/06immig.html?ref=politics.
6 See “Latinos and the 2010 Elections: Strong Support for Democrats; Weak Voter Motivation,” at http://pewresearch.org/pubs/1752/poll-latinos-and-the-2010-midterm-elect....
7 To project the Hispanic share of the 18 and older population, we use data from the months publically available in the 2010 Current Population Survey. We then assume that Hispanics will grow to the same share of the 18 and older population as they have in prior years. For their share of citizens and voters, we use the 2002 and 2006 midterm elections and use prior months of the CPS. For example, in June 2002 Hispanics were 7.5 percent of the adult citizen population and by November they were 7.6 percent. In 2006, they were 8.4 percent of adult citizens in June and in November they were 8.6 percent. We assume the same pattern for 2010. We follow the same procedure for estimating their share of voters.
8 See “Latinos and the 2010 Elections: Strong Support for Democrats; Weak Voter Motivation,” at http://pewresearch.org/pubs/1752/poll-latinos-and-the-2010-midterm-elect....
9 See “An Examination of Minority Voters’ Views on Immigration,” at http://www.cis.org/Minority-Views-Immigration.
10 Both figures are based on a Center for Immigration Studies analysis of the public-use file of the November 2008 Current Population Survey.