In pressuring Congress to expand the H-1B work visa and employment-based green card programs, industry lobbyists have recently adopted a new tack. Seeing that their past cries of a tech labor shortage are contradicted by stagnant or declining wages, their new buzzword is innovation. Building on their perennial assertion that the foreign workers are “the best and the brightest,” they now say that continued U.S. leadership in science, technology, engineering, and mathematics (STEM) hinges on our ability to import the world’s best engineers and scientists. Yet, this Backgrounder will present new data analysis showing that the vast majority of the foreign workers — including those at most major tech firms — are people of just ordinary talent, doing ordinary work. They are not the innovators the industry lobbyists portray them to be.
I presented some initial analyses along these lines in an earlier Backgrounder,1 showing for instance that STEM foreign students at U.S. universities tend to be at the less-selective universities. Here I present a much more direct analysis, making use of a simple but powerful idea: If the foreign workers are indeed outstanding talents, they would be paid accordingly. We can thus easily determine whether a foreign worker is among “the best and the brightest” by computing the ratio of his salary to the prevailing wage figure stated by the employer. Let’s call this the Talent Measure (TM). Keep in mind that a TM value of 1.0 means that the worker is merely average, not of outstanding talent.
I computed median TM values for various subgroups of interest. A summary of the results is:
- The median TM value over all foreign workers studied was just a hair over 1.0.
- The median TM value was also essentially 1.0 in each of the tech professions studied.
- Median TM was near 1.0 for almost all prominent tech firms that were analyzed.
- Contrary to the constant hyperbole in the press that American (and Western European) kids are weak at math in comparison with their counterparts in Asia, TM values for guest workers from Western European countries tend to be higher than those of the Asians.
Again noting that a TM value of 1.0 means just average, the data show dramatically that most foreign workers, the vast majority of whom are from Asia, are in fact not “the best and the brightest.”
Note that the statutory definition of prevailing wage takes into
account experience levels. In other words, the TM value for a worker compares him to workers of the same level of experience, not to the workforce as a whole. Thus the modest TM values found here for the guest workers cannot be dismissed by pointing to the fact that many of the guest workers are younger.
This article also presents further data showing an equally important point:
- Most foreign workers work at or near entry level, described by the Department of Labor in terms akin to apprenticeship. This counters the industry’s claim that they hire the workers as key innovators, and again we will see a stark difference between the Asians and Europeans.
Methodology
The analysis uses data from the Department of Labor’s Permanent labor Certification Program (PERM),2 which consists of information supplied by employers when they sponsor foreign worker for permanent residency, i.e. green cards. There are advantages to using this database rather than its H-1B cousin.
First, it addresses the concern expressed by some that H-1B Labor Condition Applications (LCAs) are merely requests for permission to hire foreign workers, without specifying actual workers, who may be chosen later. By contrast, each record in the PERM data is for an actual foreign worker, containing his actual salary and other information. (The PERM form allows an employer to specify salary as a range rather than as a single value, but this is rarely used.)
Second, the PERM data include information concerning the nationality of the foreign worker, enabling the between-country comparisons in the analysis here.
Finally, the PERM data show the current visa status of the worker, which is typically H-1B but is sometimes O-1. The law defines the O-1 visa as applying to “workers of extraordinary ability.” Since these are the workers of interest here, it gives us a basis of comparison.
Note that while most workers in the PERM database are H-1Bs, the converse is not true; many H-1Bs are not sponsored for green cards. Typically employers only sponsor their better H-1Bs for permanent residency. Thus if the PERM data show that most workers in the PERM data are not “the best and the brightest,” then even fewer of the H-1Bs overall are in that category.
The analysis uses the 2007 PERM data. The data were first screened, eliminating hourly workers, clear typographical errors, and so on.
Talent Measure Analysis
Again, I take as our Talent Measure (TM) the ratio of a worker’s salary to the prevailing wage claimed by the employer. The employer is legally required to pay at least the prevailing wage, and must state on the PERM application how that wage level was determined.3 Since the application will be rejected if the wage offered is below the prevailing wage, by definition all values of TM will be at least 1.0. The latter value means “the average worker,” i.e. of average talent, so if most workers have TM values close to 1.0, then most are probably not “the best and the brightest.”
With that it mind, let’s look at TM values, both overall and also for some specific occupations:
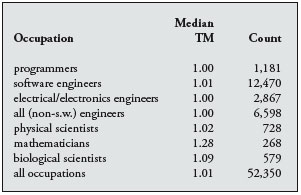
The trend, both general and for STEM occupations, is clear: Most TM values are only a little higher than 1.0, indicating that most of the foreign workers are not outstanding talents.
The sole exceptional occupation is mathematicians. Though rather few workers are in this category, the TM value is worth some comment. The anomaly is likely due to the recent interest in data mining, which has created a de facto two-tier wage structure among mathematicians, in which those who specialize in data mining are paid much more. Since the prevailing wage figures do not distinguish between these tiers, the official prevailing wage value set for mathematicians will be well below the market wage for data miners. Thus it is probable that even these foreign workers are not “the best and the brightest.”
Lobbyists for the big firms often claim that abuse of the H-1B program occurs mainly in Indian-owned “bodyshops” (firms that subcontract H-1Bs to larger companies), while by contrast the big firms are hiring “the best and the brightest.” Yet neither this scapegoating of the Indians nor the claim of hiring the top talents is warranted. Consider the TM values after disaggregation by firm:
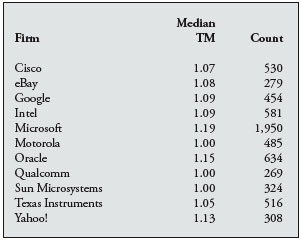
Though these figures are slightly above the overall figures we saw earlier, they still show that the firms are not paying salaries indicating top talents.
Even Microsoft, on the high end of the companies shown here, is not paying top dollar, as seen by restricting attention to Microsoft’s workers holding the O-1 visa. As O-1 is specifically for, in the phrasing of the statute, “workers of extraordinary ability,” this gives us a measure of the salaries Microsoft pays to those foreign workers who in fact are “the best and the brightest.” The median TM for Microsoft O-1 workers is 1.404. That represents a salary premium of more than double what the firm is giving its foreign workers in general, so there does not appear to be much support for Microsoft’s claim that most of their H-1Bs are of extraordinary talent.
Thus again, it is readily apparent that even the most prominent tech firms, which are in the vanguard of the industry movement pressuring Congress to expand foreign worker programs, generally do not hire from “the best and the brightest” league.
East vs. West
The lobbyists love to claim that the industry resorts to hiring foreign workers because Americans are weak in math and science. Various international comparisons of math/science test scores at the K-12 level are offered as “evidence.” The claims are specious — after all, both major sources of foreign tech workers, India and China, refuse to participate in those tests, and India continues to be plagued with a high illiteracy rate. Serious educational research, including an earlier Arizona State university report4 and a recent major study by the Urban Institute5 show clearly that mainstream American kids are doing fine in STEM.
Nevertheless, the “Asian mystique” persists. The image is that our tech industry owes its success to armies of mathematical geniuses arriving to U.S. graduate schools from Asia. Once again, though, the data do not support this perception. Here is a comparison of TM values for foreign workers from the major Asian countries and their counterparts in Europe and Canada:
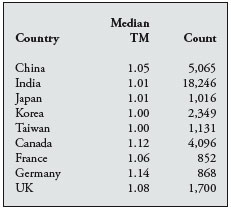
The differences here are not large, but nevertheless, all of the Western nations have higher median TM values than all the Asian nations — quite the opposite of the portrayal by the industry lobbyists.
Taking a closer look, let’s tabulate median TM for the major worker-sending nations in both hemispheres, against the major occupations:
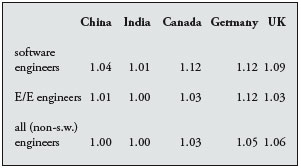
While still mild, the trend again indicates that the Western foreign workers are the more talented ones.
Finally, what about individual firms? Interestingly, the gap between East and West widens. Let’s check the firms with the largest numbers of foreign workers:
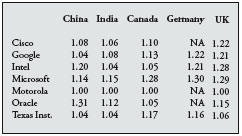
There are some interesting exceptions for China, but in general the trend follows the previous pattern.
Level of Hire
As noted, recently the industry lobbyists have adopted an innovation theme, in which they claim that the U.S. lead in tech depends on hiring innovators from abroad. The analysis above demonstrates that the foreign workers are in fact generally not outstanding talents, thus casting serious doubt on the claim that innovators are being hired. Here we pursue this point further, by examining the level at which the imported workers are hired.
The PERM data use the following classification scheme:6
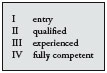
Level I is defined by the Department of Labor as for “beginning level employees who have only a basic understanding of the occupation [and who] perform routine tasks that require limited, if any, exercise of judgment.” Workers at Level II “perform moderately complex tasks that require limited judgment.” Clearly, neither Level I nor II is for innovators.
Level III implies more sophisticated responsibilities, but only Level IV suggests that innovators are being hired, workers who “plan and conduct work requiring judgment and the independent evaluation....”
Previous work7 analyzed H-1B data, finding that most H-1Bs are concentrated in Levels I and II. In the tables below we extend that work in the PERM data, adding analysis by occupation, nationality and firm.
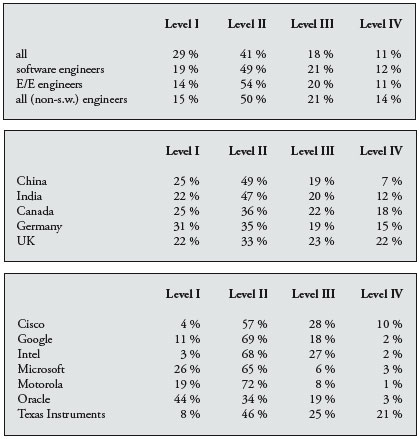
The results first show, once again, that rather few of the foreign workers are at Level IV, the level of real expertise whose description is associated with innovation. Most are in fact in Levels I and II, whose DOL definitions are for apprentice-like positions with only “limited exercise of judgment,” clearly not jobs for innovators.
Second, this pattern also holds individually for the most common job titles.
Third, the East-vs.-West pattern observed earlier for the TM data also holds for levels of expertise, with Asians typically being hired into non-innovative jobs while more Europeans are in the types of positions that could involve innovation.
The last table is striking. Most of the big firms hire almost no workers at all at Level IV. Since it is these very firms that are arguing they need foreign workers in order to innovate, there appears to be a striking disconnect between what they say and do.
Discussion and Conclusions
The lobbyists for the tech industry and the American Immigration Lawyers Association know that crying educational doom-and-gloom sells. Even though it was people born and educated in the United States who were primarily responsible for developing the computer industry, and even though all major East Asian governments have lamented their educational systems' stifling of creativity, the lobbyists have convinced Congress that the industry needs foreign workers from Asia in order to innovate.
The data show otherwise. Most foreign tech workers, particularly those from Asia, are in fact of only average talent. Moreover, they are hired for low-level jobs of limited responsibility, not positions that generate innovation. This is true both overall and in the key tech occupations, and most importantly, in the firms most stridently demanding that Congress admit more foreign workers.
Note again that the analyses presented here confirm and provide much sharper quantitative insight into previous work showing that the H-1Bs are of just average talent. It has been shown for instance that foreign students in the U.S. tend to be concentrated in the less-selective universities, and that they receive a lower percentage of research awards relative to their numbers in the student population. In the workforce, the foreign nationals in the U.S. participate in teams applying for patents at the same percentage as do the U.S. citizens, and so on.
To be sure, the author is a strong supporter of facilitating the immigration of the world's best and brightest. He has acted on that belief, by championing the hiring of extraordinarily talented researchers, mostly from India and China, into his department faculty. But as seen here, very few of the foreign workers are of that caliber.
Expansion of the guest worker programs - both H-1B visas and green cards - is unwarranted.
End Notes
1 “Best? Brightest? A Green Card Giveaway for Foreign Grads Would Be Unwarranted,” Center for Immigration Studies Backgrounder, May 2006, https://cis.org/Report/Green-Card-Foreign-Grads
2 See http://www.flcdatacenter.com/CasePerm.aspx
3 Typically the employer will cite government data as the source. The legal definition of prevailing wage in both the law and regulations contains major loopholes (see my previous Backgrounder mentioned above), but the industry lobbyists insist that the foreign workers are not underpaid. Since here the focus is on another industry claim, that the foreign workers are of outstanding talent, for the purpose of the present analysis, it will be assumed that the prevailing wage is the real market wage.
4 David Berliner, “Our Schools Versus Theirs,” Washington Post, January 28, 2001.
5 B. Lindsay Lowell, Hal Salzman, Into the Eye of the Storm: Assessing the Evidence on Science and Engineering Education, Quality, and Workforce Demand, The Urban Institute, October 2007, http://www.urban.org/UploadedPDF/411562_Salzman_Science.pdf
6 DOL, http://www.foreignlaborcert.doleta.gov/wages.cfm
7 John Miano, “Low Salaries for Low Skills: Wages and Skill Levels for H-1B Computer Workers, 2005,” Center for Immigration Studies Backgrounder, April 2007, http://www.cis.org/sites/cis.org/files/articles/2007/back407.html
Dr. Norman Matloff is a professor of computer science at the University of California, Davis.