The removal of illegal workers from the seasonal agricultural workforce would increase the summer-fall supermarket prices of fresh fruits and vegetables by about 6 percent in the short run and 3 percent in the intermediate term. During the winter-spring seasons, prices would rise more than 3 percent in the short term and less then 2 percent in the intermediate term. Imports would increase about 1 percent.
We examine the implications of successfully eliminating undocumented or illegal workers from the workforce in the United States. Our concerns are focused primarily on the implications for U.S. retail market prices of fresh fruits and vegetables, while Mexico's value of exports of fresh fruits and vegetables to the U.S. are about 50 percent of the value of U.S. production (U.S. Department of Agriculture, 1992 and 1993a). The analysis is viewed through a two-country aggregate trade model for labor and fruits and vegetables. The major sources of fresh fruits and vegetables for the U.S. market differ by season. Here we focus on one period called the winter and spring season when Mexico (and some other countries) are large exporters and the second period consisting of the summer and fall seasons when U.S. producers dominate the market.
The impact of eliminating illegal workers from the U.S. agricultural industry will have different effects in the two different periods. In both periods, there would be a rise in the U.S. wage rate for agricultural labor and an upward shift in the U.S. supply curve for fruits and vegetables. In the summer and fall period when imports are insignificant, the new immigrant policy would have its largest effect about a three percent increase in the retail market price and a 1.8 percent reduction in consumption. During the winter and spring when Mexican exports are large, closing off Mexicans' work options in the U.S. would dramatically reduce remittances to Mexican households (in Mexico) and lower real per capita income of Mexicans. We see little change on the Mexican wage rate, especially for low-skilled labor, so the main Mexican effect is a net reduction in aggregate domestic demand for fruits and vegetables due to the reduction in average household income. This frees up some fresh produce for additional exports to the United States — about a 1.25 percent increase in excess supply. With the increase in U.S. excess demand for fresh fruits and vegetables caused by the rise in the U.S. wage, the net result is about a 0.7 percent in the winter and spring period price of fresh fruits and vegetables. U.S. imports increase by about 1 percent and U.S. consumption is reduced by about 0.4 percent.
Most illegal or undocumented workers are selected into low-skilled, low-paying work in the U.S. labor market. One of the occupations available to them is "seasonal agricultural services" (SAS), which includes seasonal labor used in fruit, vegetable, and horticultural crop production. Based upon the 1989-91 National Agricultural Workers Survey, unauthorized foreign-born workers were estimated to comprise about 17% of total U.S. SAS workers, while immigrant workers, both undocumented and documented, accounted for about 22% of the labor force in the SAS industries (see Mines, Gabbard, and Samardick, 1993b, and Mines, Gabbard, and Boccalandro, 1990). In some regions of the United States, for example in California, the share of the agricultural labor force that is undocumented seems to be significantly higher than for the U.S. average rate. U.S. crop producers have shown a willingness to employ foreign-born workers because of their general willingness to perform low-skilled work well. Since the 1986 Immigration Reform and Control Act (IRCA), the market for the services of farm labor contractors (FLCs) has expanded. The FLCs have been an emerging institution for shifting the location of paperwork associated with season labor and liability associated with the use of farm labor (Martin, 1995, and Martin and Taylor, 1995). Several factors affect the wage U.S. growers are willing to pay immigrant labor. They include potential non-wage cost for hiring illegal immigrants (risk the workforce being disrupted) and low human capital skills, such as language and education which affect workers in the U.S.-labor market opportunities (Borjas and Tienda, 1993, and Taylor, 1992).
Even though the percentage of U.S. cost of production attributed to illegal or undocumented workers seems small,1 the inflow of illegal immigrants has a sizable impact on the cost of production of U.S. labor-intensive crops. In the fruit, vegetable, and horticulture (FVH) crops, labor's cost share is large than for other inputs, accounting for 37% to 44% of the total input cost in 1987.2 Thus, a change in the wage rate paid by agricultural firms will have a significant impact on the wholesale and retail cost/price of fruits and vegetables. However, the impact on retail market prices is moderated by the fact that growers and packagers command about 40% of the retail price, although the share varies by crop and season.
If no illegal or undocumented workers could in the future be employed in the U.S. labor market (and they were not replaced with guestworkers), the wage rate for services provided by FVH will rise. We assume complete elimination of illegal and undocumented workers. In this case, we estimate that the FVH industry will see about a thirty percent rise in the average wage rate for SAS labor in the short run (1 to 2 years) and about a 15 percent increase in the medium/intermediate (or 5 to 7 years) term. The implications of our paper are affected by the size of the (real) wage rate changes that we use for estimating short and intermediate term effects of immigration policy changes. We present a few reasons for our choices.
In the intermediate term, empirical evidence exists for considerable occupational mobility by U.S. citizens. We believe the upper limit to the real wage increase associated with eliminating undocumented workers from the U.S. workforce is offsetting the decline over the past 20 years in the U.S. real wage of high school dropouts relative to college graduates. This decline has been approximately 15 percent (see Mishel and Bernstein 1993, p. 166). We have less reliable information to draw upon for judging the short-term rise in the wage rate for U.S. SAS workers. However, we know that the valuable supervisory and field experience would be lost because U.S. citizens have been providing a minority of labor in SAS (see Martin et al. 1995). Hence, U.S. employers of SAS labor will need to establish new sources or channels for obtaining workers and these new workers would need training. We have translated these effects into a 30 percent increase in the wage rate for constant quality SAS labor. The change might actually be less or more, but or short- and intermediate-term results provide some interesting relative comparisons. However, we emphasize the outcomes for the medium/intermediate term, or for a 15 percent real wage change.
Our estimate is that a 15 percent rise in the real wage (30 percent in the short term) translates into a rise of about 6 percent in the real cost of fresh fruits and vegetables (12 percent in the short term), as reflected in an upward shift of the U.S. supply curve for these agricultural products. If there was no change in U.S. imports of fruits and vegetables, upward pressure on U.S. retail prices of these products would occur. During the seasons when imports of fresh fruits and vegetables have been relatively insignificant, U.S. producers have the most protection from foreign competition. We define this period to be roughly the summer and fall seasons. During this period, our prediction for the new immigration policy is a 3 percent increase in the U.S. retail price of fresh fruits and vegetables (6 percent in the short term). During the winter-spring season, when U.S. fresh fruit and vegetable producers face much greater competition due to imports from Mexico (and other countries), the U.S. retail price will be less, but U.S. producers will feel a greater squeeze on their profits.
As we noted above during some seasons, imports of fresh fruit and vegetables are significant, e.g. winter and spring. At relatively low U.S. market prices for fresh fruits and vegetables, the quantity of fresh fruit and vegetables demanded by U.S. consumers is larger than the quantity supplied by U.S. producers. Hence at this price there is an "excess demand" that can be met by imports from Mexico (and other countries). We predict the new immigration policy will shift the U.S. excess demand curve for (imported) fruit and vegetables to the right. When added imports of fresh fruit and vegetables from Mexico are possible (e.g., during winter and spring), the rise in the U.S. retail price will be moderated.
Barring Mexicans (and others) from illegally entering the U.S. labor market translates into an increase in Mexican labor available in Mexico. This increase in available labor, however, might not be accompanied by a significant decline in the Mexican wage rate (of low-skilled labor). The primary reason is the wage rate in Mexico for low-skilled labor is near the reservation wage for these workers. At the reservation wage, workers are indifferent between using their time for home production or leisure activities and working for direct pay. Support for this view comes from the relatively low Mexican labor force participation rate for adults (about 38%, see U.S. Department of Agriculture, 1993a). Because most undocumented workers have households and a home base abroad, they transfer income to or carry income/savings back to their home countries. Cuthbert and Stevens, 1981, estimated that remittances averaged between 28% and 50% on net U.S. earnings.3 Therefore, the source countries for U.S. undocumented workers will experience a reduction in remittances. Because about half of U.S. undocumented workers are Mexican born, the new policy would impact Mexican average household income significantly (Immigration and Naturalization Service, 1992). Mexican household expenditures depend on this income (and the number of person-days members spend in Mexico), so we predict a reduction in domestic demand for all goods and services having positive income elasticity. This includes fruits and vegetables.
The loss in remittance income by Mexican households due to lost U.S. earnings is estimated to be 6.9% of annual Mexican household income. With an estimated income elasticity of demand for Mexican fruits and vegetables of approximately 0.4 (and adjusting for share of annual days living outside of Mexico), the reduction in Mexican demand is about 1.0 percent. No significant change in the Mexican supply curve for fruits and vegetables is expected (at least on the short to intermediate horizon) because we have argued for no change in the Mexican wage rate, and the Mexican excess supply curves for FVH would shift to the right a small amount. Thus, with U.S.-Mexican trade, we have incentives in place to moderate slightly U.S. retail market price increases for fruits and vegetables. If there is a large rightward shift in the excess supply of fresh fruits and vegetables as a result of the new immigration policy, strong downward pressure on the U.S. retail price of fresh fruits and vegetables would occur (e.g., during the winter and spring season).4
Modeling the Impact of Stopping the Illegal Flow of Immigrant Workers in the U.S. FVH Crop Sector
The impact of eliminating undocumented workers from the U.S. labor market is examined with the aid of a two-country trade model. Four key assumptions underlie the model. Those assumptions are:
- Illegal immigration can be stopped and this study largely ignores the cost of achieving this outcome.
- All input and output markets are competitive. See Isé and Perloff, 1995, for discussion of market power in the immigrant worker market.
- Minimal trade barriers exist on fresh fruits and vegetables, and Mexico is a significant U.S. source of fresh fruits and vegetables during winter and early spring months but not during other months. The U.S. producers are the main source in these other months.
- Mexican employers (in Mexico) face a perfectly elastic supply of low-skilled labor, e.g., an increase in the quantity supplied of low-skilled labor only increases the unemployment rate in Mexico and does not affect the wage rate for low-skilled labor.
The Aggregate Labor Market
The U.S. labor market for SAS (or low-skilled) labor is assumed to have a negatively sloped aggregate demand curve and a positively sloped aggregate supply curve. Adjustments in aggregate supply/demand come about through changes in the number of workers and hours worked per worker. Figure 1 depicts the demand and supply relationships for low-skilled labor in the U.S. Here the wage is represented on the vertical axis, and the hours of work (per month) are represented on the horizontal axis. When the wage is wo, workers in the U.S. voluntarily supply Luos hours while employers demand Luod hours (per month). The distance between Lus and Lud at any wage w represents the "excess demand" for labor. At say wo, there exists a positive excess demand for labor in the United States.
Given the current wage structure and opportunities in Mexico, the labor force participation rate of adults is about 38 percent (U.S. Department of Agriculture, 1993). We believe that this relatively low labor force participation rate is consistent with a large number of not-employed, low-skilled adults having a reservation wage at some low wage, say wo. If the (real) wage were to increase slightly, a large positive supply response is expected as more adults choose to enter the Mexican labor force. Hence, the aggregate supply of low-skilled Mexican labor (in Mexico) is represented as being perfectly elastic at a wage wo in Figure 1. The aggregate demand curve for Mexican low-skilled labor has a negative slope. At any wage larger than wo, the quantity of labor Mexicans are willing to supply is larger than the quantity demanded. Hence, there is an excess supply of low-skilled Mexican labor at all wage rates above wo.
Now consider Figure 2. In this figure, the U.S. excess demand and Mexican excess supply curves for low-skilled labor are depicted. Because labor cannot move freely between the U.S. and Mexican labor markets, wage rates for low-skilled labor (in common currency), do not equalize. Moving, crossing the border, and job hunting are costly. Also, restrictive U.S. immigration legislation and incomplete enforcement can be translated into an effective tariff on immigrant labor.5 The effective tariff is represented in middle panel by to, the effective wage difference for low-skilled labor. For example, this is consistent with a U.S. wage of wuo, and a Mexican wage of wxo, and a quantity of Mexican labor imported to the U.S. of Lmo.
Consider the effects of increasing the effective tariff on labor to a prohibitive level, as is suggested by an end to illegal immigration. The effective tariff t would increase from to to say 1t (moving the constraint on the ED curve to the left). With some legal immigration continuing (at an unchanged rate) and an effective increase in inter-country labor transfer costs, the amount of imported labor would decrease from Lmo to Lm1, leaving only imports from new legal immigrants. The wages for low-skilled labor in the U.S. would increase from wuo to wu1 as a result of these changes. Under our working assumptions, there would not be a significant change in the Mexican wage rate for low-skilled workers as a result of the change in immigration policy. The Mexican unemployment rate would, however, increase.
Wage rates for low-skilled workers. Currently in the U.S. wages fro unauthorized or undocumented workers range from 10 to 15 percent lower than their cohorts with green card status (Isé and Perloff, 1995). Using the 1992 National Agricultural Workers Survey results, Isé and Perloff found that the average wage for U.S. SAS labor that had green card status was $5.73 while wages for unauthorized, undocumented workers averaged $4.93. Other studies, such as Taylor 1992 and Massey 1987, found larger wage differentials existed in some local agricultural labor markets (as high as 30%). However, larger differences existed generally in the higher skilled labor positions where human capital characteristics like English language skills and educational attainment were important. Borjas and Tienda also found a wide variation in wage rates across national origin of workers. Cuthbert and Stevens found at least a six-fold differential in earnings. However, after transportation and living expenses were deducted, only a three-fold differential in net earnings was found. For our study, we assume unauthorized workers earn $4.95 per hour on average while their authorized cohorts earn $5.70, which is about 14 percent higher. Also, the U.S. wage for unauthorized workers is approximately seven times larger than the Mexican wage of the same, averaging in U.S. dollars about $0.70 per hour.
How does the labor market adjust to changes in immigration flows? In the U.S., the demand for low-wage labor seems relatively responsive to changes in the wage — estimates of the own-price elasticity of demand range from -1.19 to -1.44 in the short run, while in the long run ranging from -1.87 to -3.14 (see Duffield, 1990, Duffield and Coltrane, 1992, and Gunter, Jarrett and Duffield, 1992). The Mexican labor demand elasticities appear to be smaller -- ranging from -0.40 to -0.44 (see Truett, Truett and Apostolakis). Duffield and Duffield and Coltrane also report estimates of the U.S. labor supply elasticity ranging from 0.35 to 0.37 in the short run and larger (0.74 to 0.76) in the long run, respectively.
Under the assumptions of a 15% increase in the wage for U.S. low-skilled labor due to eliminating illegal immigration, we estimate that the quantity of U.S. SAS labor hours demanded will decline about 19.5% in the short run and by more in the long run as better labor substitutes are developed. The U.S. workers will increase their labor supply by about 5.4% in the short run and by about two times that in the long run.
The FVH Retail Market Model
The retail market for fresh fruit and vegetables clears through the adjustments of the prices of these commodities. A "spread" exists between the retail and the wholesale or producer price. This spread varies across time and commodities. In the FVH crops, growers and packagers command about 40-45 percent of the retail market price,6 with wholesalers and retailers absorbing the remainder (see U.S. Department of Agriculture, 1987, and U.S. Department of Agriculture, downloaded).
The retail market for a representative FVH crop is depicted in Figure 3. The U.S. demand and supply curves are depicted in the left panel. The U.S. excess demand curve is obtained by subtracting the U.S. quantity of fresh produce supplied from the quantity demanded by U.S. consumers at a given price. The U.S. excess demand curve in the middle panel depicts the positive differences which exist when the retail price of fresh produce is below the intersection of the U.S. domestic demand and supply curves (puNT, the no-trade U.S. price). For Mexico, the excess supply curve for fresh produce is obtained as the Mexican quantity supplies more of the Mexican quantity demanded at a given price. The relevant part of this curve occurs where Mexico's excess supply is positive, or at a price above the intersection of the Mexican demand and supply curves for fresh produce (pxNT).
In our representation of trends in fresh fruits and vegetables we have chosen to ignore the small tariff that exists and transport costs (which are significant) with trade between the two countries in fresh produce, the pre-reform solution is represented as having a price at po (during winter or spring months).
Suppose that immigration of illegal aliens is stopped. In the U.S. market the supply curve shifts up for fresh produce. Because we have assumed as a first approximation the Mexican wage rate for low-skilled labor is unchanged, no shift occurs in the Mexican supply curve (in the short or intermediate horizon). However, the Mexican households experience a decrease in their income because of a reduction in remittance. This shifts their aggregate demand curve for fresh fruits and vegetables down from Dxo to Dx1. The overall effects on the trade or market price for fresh produce depends on the magnitude of the shifts. In principle, the market price could rise or fall.
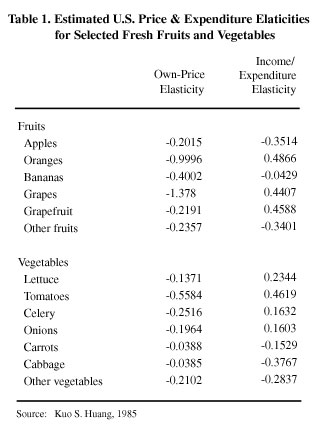
U.S. FVH Market Conditions. The responsiveness of U.S. demand for fresh fruits and vegetables is important to market adjustments. A review of the literature shows considerable variation in the size of the own-price and income elasticity of U.S. demand for fresh fruits and vegetables (See Table 1.) For fruits, the own-price elasticity is relatively large for grapes (-1.4) and oranges (-1.0) and for vegetables and tomatoes (-0.6). In another study, Shonkwiler and Emerson have estimated the own-price elasticities for fresh winter tomatoes to be -0.8. The own-price elasticities of demand are relatively small (inelastic) for all other fresh fruits and vegetables. Turning to the income/expenditure elasticity of demand in Table 1, all fruits and vegetables have income elasticities that are less than one. The largest elasticities are for citrus fruits — oranges and grapefruit (0.5), grapes (0.4), and tomatoes (0.5). Some of the fresh fruits and vegetables are inferior goods, meaning that the quantity demanded decreases when real income increases, other things equal. These goods are apples (-0.4), "other" fruit (-0.3), bananas (-0.04), cabbage (-0.4), "other" vegetables (-0.3) and carrots (-0.2). In this study we assume the own-price elasticity of demand for winter/spring FVH crops to be -0.60.
Also, the responsiveness of U.S. supply of fresh fruits and vegetables is also part of the market story. We have less evidence here. The U.S. short-run supply elasticity for U.S. fresh fruits and vegetables is relatively own-price inelastic, say about 0.2 (e.g., see Torok and Huffman, 1985, for evidence on fresh tomatoes). The U.S. long-run supply elasticity is larger, perhaps as large at 0.8. Because hired labor is a major input cost to fresh fruit and vegetable production, the U.S. aggregate supply is quite responsive to a change in the wage. For example, Torok and Huffman (1985) present wage elasticity of U.S. excess demand of -1.1. For this study we assume the own-price elasticity of U.S. supply to be 0.5 (which is for a modest length planning horizon by producers).
Mexican FVH Market Conditions. In the Mexican FVH market we expect different price and income elasticities than for the U.S. The main reasons are the large real income per capita/household differences, social and cultural differences, along with other environmental differences. Although we do not have direct estimates of own-price and income elasticities for Mexico, results from Spain are available. The attributes of the Spanish diet, climate, culture and level of development make Spanish results better than U.S. estimates for Mexico. Chung's estimate for an own-price elasticity of demand for fruits and vegetables for Spain is about -1.0 and an income elasticity of about 0.4 (for low income levels).
We derive an estimate of remittances to Mexico by currently U.S. employed undocumented Mexican workers. In the National Agricultural Worker Survey (NAWS), immigrant non-contract labor earn an average of $6,900, in 1989 real dollars, while their contracted cohorts earned $4,700. We assume that of these workers the illegal workers would be more likely to be contract workers. Hence, we estimate the loss in income would be approximately $4,700. If these workers were able to send (or take) one-half, on average, back to their Mexican household, then stopping illegal immigration causes a decrease in Mexican real per-capita income of about 6.9%.7 If a smaller share of income earned in the United States is actually transferred to Mexico, the reduction in Mexican household income would be less. Using the 6.9 percent real income reduction and assuming an income elasticity of 0.4,8 we estimate a reduction in aggregate demand for fresh fruits and vegetables in Mexico of approximately 1%.9
Some might be skeptical about Mexican fresh fruits and vegetables producers' response to export prices. In Figure 5, we show the Mexican exports of tomatoes and melons by month for January, February and March for 1994 and 1995. Recall that the value of the Mexican peso was relatively stable until December 1994, then depreciated against the U.S. dollar by about 30 percent. Both crops show significant increases for 1995 over 1994 in the quantities exported to the United States (20-30%). Not all fruit and vegetable exports, however, show increases for 1995 over 1994, e.g., squash, cucumber, and green peppers were approximately unchanged. There are few econometric estimates of Mexican supply responses in the literature. Torok and Huffman have shown a very inelastic excess supply curve for Mexican producers of fresh winter tomatoes, using monthly data. We assume that the own-price elasticity of supply for Mexican fresh fruit and vegetable producers is 0.8, which is about 60 percent larger than for U.S. producers over a modest length planning horizon.
The Summer/Fall Fresh Fruit and Vegetable Market
Without significant imports from Mexico, an increase in the cost of U.S. production for fresh fruits and vegetables means upward pressure on U.S. retail prices. Hence, U.S. producers will be reacting to both an upward shift in their marginal cost curves and a rise in the market price. The U.S. will reduce their consumption of fresh fruits and vegetables because of the higher market prices.
The overall impact of eliminating illegal immigration on the Summer/Fall FVH market is represented in Figure 4. The supply curve will shift up from S0 to S1, which we estimate to be about a 2.5% rise in prices at a given quantity because of a 15% increase in the wage rate (or a 5.5% increase in prices for the 30% wage increase). The market price will rise from p0NT to p1NT. Given a U.S. elasticity of demand for fresh fruits and vegetables of -0.6 and a U.S. elasticity of supply of fresh fruits and vegetables of 0.5, the U.S. fresh market price for fruits and vegetables in the summer and fall period will increase about 3 percent (over a modest length planning horizon). This translates into about a 2 percent reduction in the U.S. marketed (or consumed) quantity of fresh fruits and vegetables. This seems to be a small change, given the elimination of illegal workers in the United States.
The Winter/Spring Fresh Fruit and Vegetable Market
During this period, significant imports from Mexico occur. Eliminating illegal immigrant workers in the U.S. would affect U.S. markets differently than when imports are insignificant. The total effects are represented in Figure 2. In the upper slides, labor market conditions are shown for both the U.S. and Mexico. For this period we also assume the wages would increase 15% (30% in the short term) in the U.S., increasing the cost of production in the U.S. by about 6% (12% in the short term). In Mexico, the labor supply is perfectly elastic, so the impact of closing the borders to illegal aliens in funneled through income effects on aggregate demand for fruits and vegetables and other goods. For fresh fruits and vegetables the U.S. excess demand and Mexican excess supply curves shift to the right.
With a U.S. price elasticity demand of -0.6 and supply elasticity of 0.5 and Mexican price elasticity of demand of -1.0 and supply elasticity of 0.8, these shifts translate into about a 1.7% increase (3.8% in the short term) in the market price of fresh fruits and vegetables in the winter-spring period (P1 versus P0). These adjustments translate into about a 1.0 percent increase in the traded quantity of fruits and vegetables during this season (QT1 versus Q>sub>T0) and about a 0.4% decrease in U.S. consumption of fresh fruits and vegetables (Qud1 versus Qud0).
Hence, the impacts of a new stringent U.S. illegal immigrant worker policy are expected to be very small on U.S. fresh fruit and vegetable markets during the winter and spring period in an environment of low trade barriers to importers of fresh fruits and vegetables from Mexico (and other countries).
End Notes
1 With only 17% of the total SAS force being undocumented and labor accounting for less than 50% of the production costs, it might appear that there would be little if any impact on the cost of production.
2 See U.S. Department of Agriculture, 1991, 1992, and 1993b for discussions on farm labor demographics and implications on farm size.
3 Of the estimated 2 to 4 million illegal immigrants in the U.S., it is estimated that 50% to 55% are of Mexican origin. If true, the illegal immigrants working in the U.S. comprise between 9% and 18% of the work force in Mexico (See Chiswick, 1988, and U.S. Department of Agriculture, 1993b).
4 U.S. FVH firms are sensitive to changes in imports. Shonkwiler and Emerson have shown that a 10% increase in Mexican imports of tomatoes reduces the prices paid to Florida tomato growers 2.68% but lowers the quantity supplied by 5.91%.
5 Immigrants must decide whether to cross the border legally or illegally. Costs relative to the benefits play a major role in the decision process. Increases in border enforcement efforts would increase cost of illegal immigration relative to the benefits (See Chiswick, 1988).
6 The exception is strawberries, where growers and packagers command up to 65% of the retail value (U.S. Department of Agriculture, 1987 and U.S. Department of Agriculture, downloaded).
7 This was estimated by taking aggregate private consumption expenditures for 1989 (356,900) million New Pesos) and dividing estimated pesos remitted (50% at annual personal income, 12,400 New Pesos times 2.0 million undocumented workers equaling 24,800 million New Pesos).
International Monetary Fund, 1955 and Immigration and Naturalization Service, 1993.
8 In Chung, the income/expenditure elasticities for fruit and vegetables in low-income Spanish households range between 0.37 and 0.39. Since Mexican expenditures are slightly lower than those in Spain, we assume the expenditure elasticity to be 0.4, which is consistent with Chung's estimates for lower income households.
9 The reduction in Mexican aggregate demand was estimated using the relationship Q=q n D where Q is the aggregate demand, q is the quantity consumed per capita per day, n is average number of Mexicans in Mexico per day, and D is the average number of days Mexicans are in Mexico during the year. Then,
%ΔQ = %Δq + %Δn + %ΔD.
We assume that %Δn equals zero and
%Δq = ηqI (%Δ income),
where ηqI is the income/expenditure elasticity for fruits and vegetables, estimated to be 0.4. We estimate the percentage change in income to be -6.9%, therefore the percentage change in q is about 2.76%. In the NAWS, alien SAS workers seem to spend 7 weeks back in Mexico per year. We assume illegal immigrants spend more time on average in Mexico, 14 weeks. We the estimate the percentage change in days spent in Mexico by weighting illegal immigrant population by (1 - 14/52). Then,
%ΔD = 0.73 Spop,
where Spop equals 2 million divided by 84.49 million, 0.024, implying that the percentage change in days spent in Mexico is approximately 1.63%. Finally,
%ΔQ = -2.76 + 0.0 + 1.73 = -1.03%.
(see U.S. Department of Labor, 1992, Immigration and Naturalization Service, 1993, and International Monetary Fund, 1995 for population numbers, exchange rates, and remittances.)
References
Borjas, G.J., and M. Tienda, 1993. "The Employment and Wages of Legalized Immigrants." International Migration Review 27: 712-747
Chiswick, B.R. "Immigration Policy and Illegal Aliens." In Illegal Aliens: Their Employment and Employers. Kalamazoo: W.E. Upjohn Institute for Employment Research, 1988a.
Chiswick, B.R. 1988b. "Illegal Immigration and Immigration Control." Journal of Economic Perspectives 2(3): 101-115.
Chung, Ching-Fan. 1994. "A Cross-Section Demand Analysis of Spanish Provincial Food Consumption." American Journal of Agricultural Economics 76: 513-521.
Cuthbert, R.W., and J.B. Stevens. 1981. "The Net Economic Incentive for Illegal Mexican Migration: A Case Study." International Migration Review 15(3): 543-550.
Duffield, J.A. Estimating Farm Labor Elasticities to Analyze the Affects of Immigration Reform. Staff Report prepared for the Economic Research Service division of the U.S. Department of Agriculture. Washington, D.C.: GPO, 1990.
Duffield, J.A. and R. Coltrane. 1992. "Testing for Disequilibrium in the Hired Farm Labor Market." American Journal of Agricultural Economics 74: 412-20.
Gunter, L.F., J.C. Jarrett, and J.A. Duffield. 1992. "Effect of U.S. Immigration Reform on Labor-Intensive Agricultural Commodities." American Journal of Agricultural Economics 74: 897-906.
Huang, K.S. U.S. Demand for Food: A Complete System of Price and Income Effects. Technical Bulletin prepared for the division of the Economic Research Service of the U.S. Department of Agriculture. Washington, D.C.: GPO, 1985.
Immigration and Naturalization Service. Statistics Division of the Office of Statistical Planning. 1992. Estimates of the Resident Illegal Alien Population. Washington, D.C.: GPO.
International Monetary Fund. International Financial Statistics. Washington, D.C., 1995. Vol. 48, No. 8.
Isé, S. and J.M. Perloff. 1995. "Legal Status and Earnings of Agricultural Workers." American Journal of Agricultural Economics 77: 375-86.
Martin, P.L. "IRCA and Agriculture: Hopes, Fears, and Realities." In Immigration Reform and U.S. Agriculture, edited by P.L. Martin, et al. Oakland: University of California, 1995.
Martin, P.L., W.E. Huffman, R. Emerson, J.E. Taylor, and R. Rochin, eds., Immigration Reform and U.S. Agriculture. ANR Publications, University of California, Oakland, 1995.
Martin, P.L. and J.E. Taylor. "IRCA's Effects in California Agriculture." In Immigration Reform and U.S. Agriculture, edited by P.L. Martin et al. Oakland: University of California, Oakland, 1995.
Massey, D.S. 1987. "Do Undocumented Migrants Earn Lower Wages than Legal Immigrants? New Evidence from Mexico." International Migration Review 21(2): 236-74.
Mines, R., S. Gabbard, and B. Boccalandro. Findings from the National Agricultural Workers Survey (NAWS), 1990: A Demographic and Employment Profile of Perishable Crop Farm Workers. Report prepared for the Office of Program Economics in the Office of the Assistant Secretary for Policy, a division of U.S. Department of Labor, Washington, D.C.: GPO, 1991.
Mines, R., S. Gabbard, and R. Samardick. U.S. Farmworkers in the Post-IRCA Period: Based on Data from the National Agricultural Workers Survey (NAWS). Report prepared for the Office of the Assistant Secretary for Policy in the Office of Program Economics, a division of the U.S. Department of Labor, Washington, D.C.: GPO, 1993b.
Mishel, L. and J. Bernstein. The State of Working America. Economic Policy Institute Series. Armonk, N.Y.: M.E. Sharpe, 1993.
Oliviera, V.J., A.B.W. Effland, J.L. Runyan, and S. Hamm. Hired Farm Labor Use on Fruit, Vegetable, and Horticulture Specialty Farms. Economic Report prepared for the Economic Research Service division of the U.S. Department of Agriculture. Washington, D.C.: GPO, 1993.
Shonkwiler, J.S., and R.D. Emerson. 1982. "Imports and the Supply of Winter Tomatoes: An Application of Rational Expectations." American Journal of Agricultural Economics 64: 634-41.
Taylor, J.E. 1992. "Earnings and Mobility of Legal and Illegal Immigrant Workers in Agriculture." American Journal of Agricultural Economics 74: 889-96.
Torok, S.J. and W.E. Huffman. 1986. "U.S.-Mexican Trade in Winter Vegetables and Illegal Immigration." American Journal of Agricultural Economics 68: 246-60.
Truett, L.J., D.B. Truett, and B.E. Apostolakis. 1994. "The Transcost Function and Import Depand: The Case of Mexico." Southern Economic Journal 60: 685-700.
U.S. Department of Agriculture, 1993a. World Agriculture: Trends and Indicators, 1970-1991. Statistical Bulletin No. 861. Washington, D.C.: GPO.
U.S. Department of Agriculture, 1993b. Farm Labor. Washington, D.C.: GPO.
U.S. Department of Agriculture, 1992. Farm Production Expenditures: 1991 Summary. No. Sp Sy 9(92). Washington, D.C.: GPO.
U.S. Department of Agriculture, 1991. Farm Employment and Wage Rates, 1910-1990. Statistical Bulletin No. 822. Washington, D.C.: GPO.
U.S. Department of Agriculture, 1987. Fresh Fruit and Vegetables: Prices and Spreads in Selected Markets, 1975-84. Statistical Bulletin No. 752. Washington, D.C.: GPO.
U.S. Department of Agriculture, 1993. U.S. Farmworkers in the Post-IRCA Period. Research Report No. 4. Washington, D.C.: GPO.
Wallace Huffman is Professor of Economics and Agricultural Economics, and Alan McCunn is a Ph.D. candidate, both at Iowa State University.