Summary
Explanations of shifts in Congressional representation among states have often overlooked the effects of international migration on the size, and particularly the distribution of the U.S. population. Some 70 percent of all immigrants have consistently tended to settle in six states: California, New York, Texas, Florida, New Jersey and Illinois.
Estimates of the distribution of immigrants in the 1950-1980 period show that the top six states of immigrant settlement had 16 more seats in 1980 than they would have had in the absence of immigration. California alone gained six seats through immigration in that period, 40 percent of its total increase in representation. Two of Florida's 11 added seats were due to foreign newcomers and their children.
The shift of seats to immigration-heavy states is likely to accelerate in the next three decades as immigration remains high and the country's natural increase continues to slow. Using Census Bureau population projections and applying existing distribution ratios for immigrants and their children, it is estimated that with net immigration of 450,000 yearly the six major immigrant receiving states will have increased their share of congressional seats from 161 in 1985 to 179 in 2010, with seven of the 18 added seats attributable to immigration. A net immigration level of 750,000 yearly would enable the six receiving states to increase their share over the next three decades to 184, 12 seats more than they would have had without immigration.
California would be the major winner under either projection, gaining four of its additional thirteen seats in 2010 from assumed annual immigration of 450,000, or seven of 15 additional seats attributable to foreign newcomers if immigration continues at 750,000 a year.
Introduction: Population and Representation
The Constitution of the united States (Article I, section 2, and the Fourteenth Amendment) provides that: (a) all persons in the nation shall be counted every ten years; and (b) based on those census results, the House of Representatives shall be reapportioned every ten years. Reapportionment follows the decennial census. After census data are tabulated and approved by the Secretary of Commerce, a mathematical formula is applied that determines whether states lose, gain or remain unchanged in their representation in the House of Representatives.
Not surprisingly in our highly mobile society, a number of shifts in Congressional seats occurs every decade. For example, the 1980 census caused New York state to lose five seats while Florida gained four.
Shifts of Population Among States
The population of a state can change only because of shifts in natural increase (i.e. births deaths) or net migration (i.e. in-migration, out-migration). Except for a few states like Alaska, New Mexico and Utah, fertility varies little among the states. Variations in mortality among states are also slight. So the key factor in population change among states is net migration. In the cases of New York and Florida, both had similar fertility rates, although mortality was higher in Florida because of its older population. However, New York experienced substantial net out-migration while Florida received many new residents. As a result New York's population fell from 18.2 to 17.5 million between 1970 and 1980, while Florida's increased from 6.8 to 9.7 million.
Explanations of loss or gain in Congressional representation have generally disregarded international migration (as opposed to domestic migration) as a factor. The usual explanation of New York's loss and Florida's gain is that many New Yorkers are moving to the "Sun Belt." While this is true, net immigration also contributes to shifts in population.
With fertility — now 1.8 live births per woman — at historical lows and with immigration approaching historical highs, immigration's contribution to national growth is increasing and will continue to do so. In the 1980s, legal immigration will account for at least one-third of the nation's growth. If illegal immigration is considered, that share will probably surpass 40 percent. If fertility remains low, it is quite likely that soon after the turn of the century, immigration will account for all of the nation's population growth.
All population changes come from variations in natural increase and net migration. But both these factors have an immigration dimension. Some portion of the migration in or out of any state is international. Similarly, some of the births and the deaths in a state occur to immigrants. The full impact of immigration on population is not limited to the number that enters a region; it also includes the births and deaths that occur to these new residents. .
Immigrants to the United States do not distribute themselves evenly across the nation. In fact, some 70 percent of all legal immigrants tend to settle in six states: California, New York, Texas, Florida, New Jersey and Illinois. An even larger proportion of illegal immigrants lives in these same six states. Immigration, by altering the size and distribution of the population, affects Congressional reapportionment.
Immigration's Effects Since 1950 on Apportionment
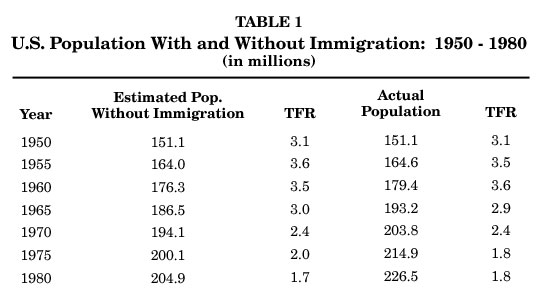
Understanding future changes in population distribution requires first a look back to the period of 1950 to 1980. Over those thirty years, almost 10.5 million people immigrated legally to the United States. Over the same three decades, the nation's population grew from 151.1 to 226.5 million. How much of that increase of 75.4 million was attributable, directly and indirectly, to immigration?
To arrive at an estimate of the impact of immigration the 1950 United States population was projected by age and sex to 1980 assuming no immigration. The total fertility rates (TFR) and the survival rates used for each five-year period replicated, as nearly as possible, the actual situation. However, immigration was not included. The results are in Table 1. Immigration over that thirty year period accounted for about 21.6 million (or 29 percent) of the nation's overall population in- crease, about half of which was actual net legal and illegal immigration and half natural increase among immigrants.
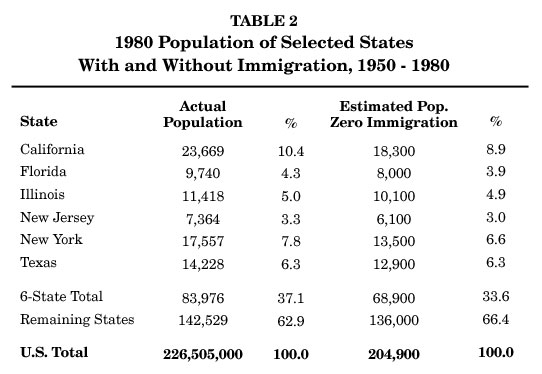
The contribution of immigrants to the population of the states must also be estimated, particularly that of the larger states most likely to be preferred areas of immigrant settlement. About 70 percent of all immigrants tend to live in just six states, a proportion that has remained relatively constant for many years. Furthermore, the share in each of the six states varied little within that thirty year period. Thus, the 21.6 million immigrants and their children who accounted for a portion of the nation's growth between 1950 and 1980 were distributed among the states in a similar manner: 25 percent were in California, 19 percent in New York, 8 percent in Florida, 6 percent each in New Jersey, Texas and Illinois, and the remaining 30 percent were in the remaining forty-four states and the District of Columbia.
The resulting numbers are then subtracted from the actual state totals for 1980 to give us an estimate of what the populations of these states would be in 1980 if there had been zero immigration since 1950. (See Table 2). As expected, their respective shares of the total population declined. For example, California's share fell from 10.4 percent to 8.9; New York's fell from 7.8 to 6.6 percent.
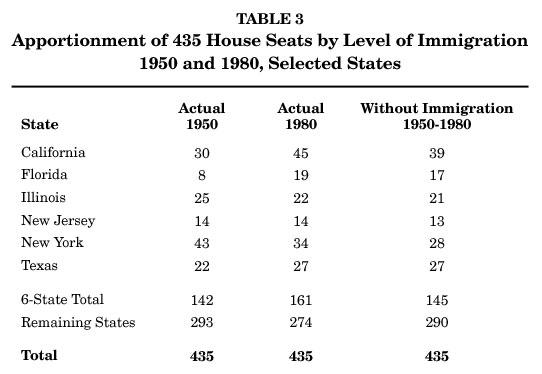
Such shifts in proportion do not necessarily translate fully into comparable shifts in congressional seats. The allocation formula based on the "zero immigration" population for 1980 was recalculated to determine what would have been the states' respective shares of House of Representative seats if there had been no immigration since 1950. This is summarized in Table 3.
Because of immigration in this period states lost or gained power in Congress in several ways:
- by absolute increases beyond what normal domestic growth would have yielded (California);
- by retention of seats that would otherwise have been lost under normal domestic demographic trends (New York); and
- by the loss of prospective seats which above average population growth would have otherwise produced in the absence of high immigration settlement elsewhere (Georgia).
Among the winners, losers and hypothetical losers of seats as a result of immigration in 1950-1980 were:
- California, which gained six of its 15-seat increase, or 40 percent, through new foreign residents and their offspring.
- Florida, which owes two of its 11-seat increase to immigrants.
- New York, which lost nine seats, but retained six it would have lost had there been no immigration.
- Michigan, which kept up with the rate of natural increase and added 2.9 million people in the three decades, but showed no gain in seats for the period.
- Georgia, which in the 1950-1980 period grew nearly 17 percent faster than the national average and increased its population by two million, but gained only one seat.
- The 44 states of low-immigrant settlement that among them shared 16 fewer seats than they would have in the absence of immigration.
This method of determining the contribution of immigration, direct and indirect, is approximate at best. But even if the effect of immigration were cut by half, it would still mean a politically significant shift of eight seats between states of high immigration density and those of immigration scarcity. with the demographic shifts now occurring in both fertility and immigration, immigration's impact on representation must be expected to remain significant in future years.
Looking Ahead to The Next Three Decades
Tracing the future is considerably more risky and confronts us with unknowns. Will fertility remain at its present all-time low? Will the levels of immigration keep climbing? Will the 1986 legislation succeed in reducing illegal entries? Will the emigration rate of U.S. residents change? will Congress change legal immigration rules, and how?
Estimates of the allocation of congressional seats for 1980-2010 rely on Census Bureau projections. In 1984 the bureau prepared a series of alternative population projections for the period 1983-2080. Later, state level projections were developed based on the national projection's medium estimate.
The Census Bureau's medium projection assumed that: the total fertility rate would rise slightly to 1.9; life expectancy would eventually reach 81 years; and net immigration would remain constant at 450,000 per year. There was no assumption of a higher fertility rate for non-black minorities, or for future immigrants. And the bureau's net immigration assumption does not account for the untold thousands of illegal entries every year. Finally, when the Census Bureau made its projections there was no way of foreseeing the 1987-1988 amnesty. While we cannot adjust our figures for the low fertility assumption for immigrants and minorities, we will adjust them for the omission of the persons who were legalized during the year ending May 4, 1988.
According to a May, 1988 INS report, of the more than 1.6 million applicants for legalization under the general amnesty, 54 percent lived in California and another 19 percent lived in Texas. An unknown number of these 1.6 million were probably enumerated in the 1980 census. Perhaps one million were not counted. That total is then increased over the 1990-2010 period by 20 percent to account for natural increase. These 1.2 million persons are then distributed among the states. This gives a revised projection of the 2010 population based on the assumption of annual net immigration of 450,000. (See Table 4).
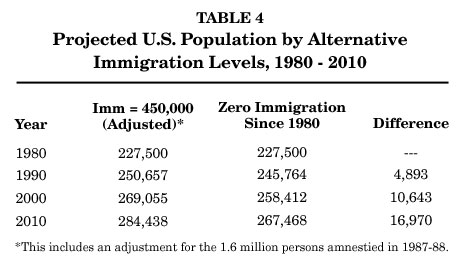
One set of the Census Bureau's series of projections, which assumes no immigration whatsoever, projects that by 2010 the nation's population would be 267 million, or 16.9 million less than estimated by our revised version of the assumption of net immigration of 450,000. So even under the Census Bureau's conservative projections of immigration between 1980 and 2010, 16.9 million of the 57 million increase in population would come from immigrants or their children.
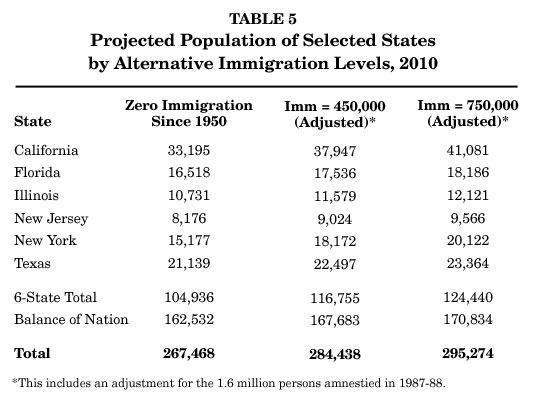
These 16.9 million additional people are then distributed by their intended state of residence according to the most recent data from INS. Immigrants' preferences for states of settlement in the 1970s have persisted in subsequent years. That is, about 28 percent plan to live in California, 18 percent in New York and so on. The projected distribution of the immigrant population by major settlement states appears in Table 5.
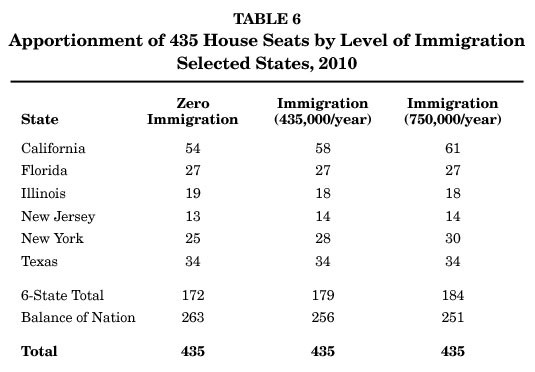
The next step is to determine the allocation of seats under both sets of assumptions: one with 450,000 net immigration annually; the other with zero immigration after 1980. Table 6 shows that immigration again weighs heavily in reapportionment.
Even with the assumption of zero immigration after 1980, California's seats in Congress will increase from 45 to 54. However, with net immigration of 450,000 per year, that number would rise to 58, giving California four more seats and New York three more than they would have had without immigration. Other shifts of seats would be minimal. The top six immigrant receiving states would have missed out on the prospective gain of seven seats if immigration had ended in 1980. Those seats would have been distributed among the remaining 44 states.
Reapportionment Under Assumptions of Higher Immigration
The Census Bureau's assumption of net immigration of 450,000 is quite conservative. Legal immigration has grown considerably to over 600,000 per year in 1986 and 1987, and when legalizations are included could easily reach 8 million for the decade of the 1980s. Illegal entries have remained high, though there are some early indicators of decline since the passage of the 1986 Immigration Reform and Control Act. Fertility of some new immigrant groups tends to be higher than that of resident Americans. Given these trends, the higher immigration scenario prepared by the Census Bureau seems more realistic. Here the Census Bureau assumes annual net migration of 750,000 per year, but builds in the same low fertility assumption as in its medium range projection.
Since the Census Bureau's state-level projections are based on their medium projection, adjustments must be made to use it for estimating state populations under this higher scenario. The difference is prorated between the two projections in the total population of the country among the states according to their past shares of the immigrant population. Table 5 (above) summarizes the results.
Table 6 shows a substantial shift in Congressional representation. A comparison of the share of seats held by the six major immigrant-receiving states to those held by all other states highlights the transforming effect of high immigration on the distribution of political power.
- with zero immigration after 1980, the number of seats held by the six leading receiving states, now 161, would rise to 172 in 2010.
- with immigration limited to 450,000 per year, that number would rise to 179.
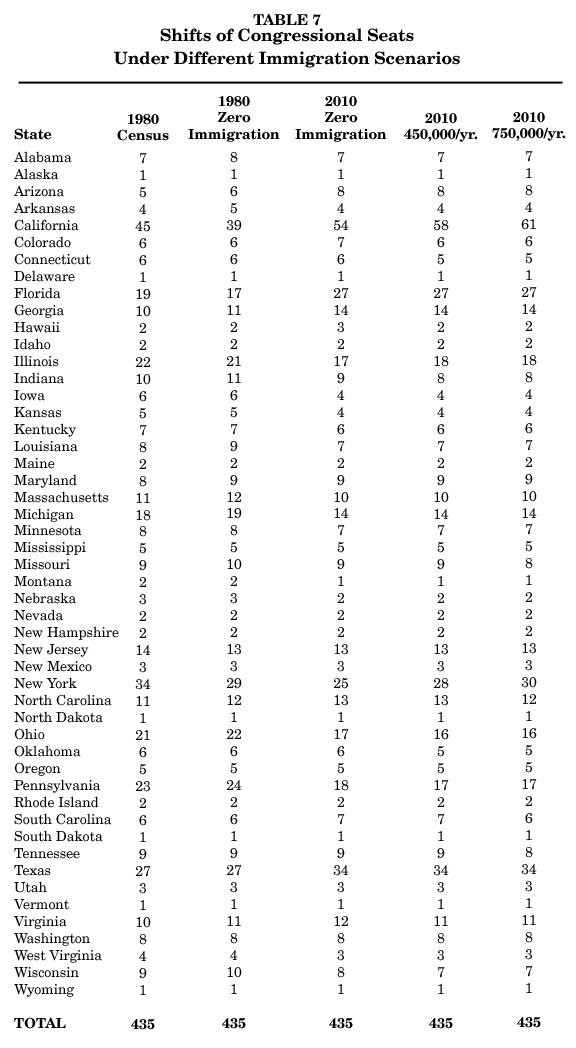
- with immigration of 750,000 per year, the six states would control 184 seats or 42 percent of the seats in the House of Representatives by 2010. (See Table 7 for various outcomes for all fifty states.)
- with immigration of 750,000 per year, California would control 14.0 percent of the House of Representatives with 61 seats. Thirteen of these seats, or more than 40 percent of the increase, would have been gained through immigration-based population increases since 1950.
In the current Congress the six immigrant receiving states have 161 seats, 37 percent of the total.
Conclusion
This approximation of future population for the nation and selected states confirms that immigration is an increasingly important factor in determining the distribution of House seats. It will become even more important as natural increase declines rapidly because of low fertility.
But caution is needed: The zero immigration scenario cannot be assumed to reflect real world behavior. Recent research has shown that domestic migration among states is itself influenced by the volume of immigrant settlement in certain states. It follows that if immigration were in fact reduced, domestic movements might increase to such states as California which have long been attractive to both domestic and foreign migrants.
Demographer Leon Bouvier has taught demography and demographic techniques at the University of Rhode Island, Tulane and the East-West Population Center in Honolulu. Bouvier, a former Vice President of population Reference Bureau, is the author of numerous works on population and immigration, including Future Racial Composition of the United States (Washington: Population Reference Bureau, 1982). He is currently a professor in the Department of Sociology at Old Dominion University, Norfolk, Virginia.