Download a pdf of this Backgrounder
Steven A. Camarota is Director of Research and Jessica M. Vaughan is Director of Policy Studies at the Center for Immigration Studies.
This study examines academic and government research on the question of immigrant crime. New government data indicate that immigrants have high rates of criminality, while older academic research found low rates. The overall picture of immigrants and crime remains confused due to a lack of good data and contrary information. However, the newer government data indicate that there are legitimate public safety reasons for local law enforcement to work with federal immigration authorities.
Among the findings:
- The Department of Homeland Security (DHS) estimates that immigrants (legal and illegal) comprise 20 percent of inmates in prisons and jails. The foreign-born are 15.4 percent of the nation’s adult population. However, DHS has not provided a detailed explanation of how the estimates were generated.
- Under contract to DHS in 2004, Fentress, Inc., reviewed 8.1 million inmate records from state prison systems and 45 large county jails. They found that 22 percent of inmates were foreign-born. But the report did not cover all of the nation’s jails.
- The 287(g) program and related efforts have found high rates of illegal alien incarceration in some communities. But it is unclear if the communities are representative of the country:
- Maricopa County, Ariz.: 22 percent of felons are illegal aliens;
- Lake County, Ill.: 19 percent of jail inmates are illegal aliens;
- Collier County, Fla.: 20 to 22 percent of jail inmates and arrestees are illegal aliens;
- Weld County, Colo.: 12.8 to 15.2 percent of those jailed are illegal aliens.
- DHS states that it has identified 221,000 non-citizens in the nation’s jails. This equals 11 to 15 percent of the jail population. Non-citizens comprise only 8.6 percent of the nation’s total adult population.
- The Federal Bureau of Prisons reports that 26.4 percent of inmates in federal prisons are non-U.S. citizens. Non-citizens are 8.6 percent of the nation’s adult population. However, federal prisons are not representative of prisons generally or local jails.
- A Pew Hispanic Center study found that, of those sentenced for federal crimes in 2007, non-citizen Hispanics were 74 percent of immigration offenders, 25 percent of drug offenders, 8 percent of white collar offenders, and 6 percent of firearms offenders. Non-citizen Hispanics are 5.1 percent of the nation’s adult population. However, the report does not provide information for other crimes or for non-Hispanic immigrants.
- Recent reports by the Public Policy Institute of California (PPIC) and Immigration Policy Center (IPC) showing low rates of immigrant incarceration highlight the data problems in many studies. The 2000 Census data they used are not reliable.
- An analysis of the data used in the PPIC and IPC studies by the National Research Council found that 53 percent of the time the Census Bureaus had to make an educated guess whether a prisoner was an immigrant. The studies are essentially measuring these guesses, not actual immigrant incarceration.
- The poor quality of data used in the PPIC and IPC studies is illustrated by wild and implausible swings. It shows a 28 percent decline in incarcerated immigrants 1990 to 2000 — yet the overall immigrant population grew 59 percent. Newer Census data from 2007 show a 146 percent increase in immigrant incarceration 2000 to 2007 — yet, the overall immigrant population grew only 22 percent.
- The Survey of Inmates in State and Federal Correctional Facilities shows that 8.1 percent of prisoners in state prisons are immigrants (legal and illegal). However, the survey excludes jails and relies on inmate self-identification, which is likely to understate the number of immigrants.
- In 2009, 57 percent of the 76 fugitive murderers most wanted by the Federal Bureau of Investigation (FBI) were foreign-born. It is likely however that because immigrants can more readily flee to other countries, they comprise a disproportionate share of fugitives.
- Most studies comparing crime rates and immigration levels across cities show no clear correlation between the immigrant share of a city’s population and its level of crime. This is one of the strongest arguments that immigrants do not have high crime rates. However, such studies generally measure only overall crime, not crimes specifically committed by immigrants, so their value is limited. And a 2009 analysis by the Department of Homeland Security’s Office of Immigration Statistics found that crime rates were higher in metropolitan areas that received large numbers of legal immigrants, contradicting several older cross-city comparisons.
- From 1998 to 2007, 816,000 criminal aliens were removed from the United States because of a criminal charge or conviction. This is equal to about one-fifth of the nation’s total jail and prison population. These figures do not include those removed for the lesser offense of living or working in the country illegally. The removal and deportation of large numbers of criminal aliens may reduce immigrant incarceration rates because many will not return and re-offend, as is the case with many native-born criminals.
- Some have argued that the fall in national crime rates since the early 1990s is evidence that immigration may actually reduce crime. However, overall crime rates are affected by so many factors that it is a very poor way to examine a link between immigration and crime. The 1970s and 1980s saw crime rates rise along with immigration levels.
- Overall incarceration rates are also a poor means of examining the link between immigration and crime. Since the 1970s, the share of the U.S. population that is incarcerated has grown almost exactly in proportion to the share of the population that is immigrant. But unless inmates can be identified as immigrant or native-born this information sheds little light on the issue of immigrant criminality.
- A central problem when looking at prison populations is that many inmates have been imprisoned for a long time. Therefore, today’s prison population partly reflects the nation’s demographics of earlier years when immigrants were a smaller fraction of the population. To make an accurate comparison one has to adjust for length of sentences and the growth of the immigrant population over time.
Introduction
Preventing the admission of criminals has long been a concern to the public and policy makers. Even in the colonial period, there were laws against the arrival of criminals. Laws barring admission to the United States for those who have committed certain crimes remain in force today. A significant share of the public seems to believe that immigrants commit a disproportionate share of crime. High-profile and sometimes tragic crimes committed by illegal aliens have prompted state and local officials to pledge action to rid the community of criminal aliens. Top federal immigration officials, as well as top congressional and executive branch officials, emphasize repeatedly that aliens who commit crimes are a top enforcement priority, partly by launching big-ticket programs to accelerate the pace of removals. Meanwhile, many advocates for immigrants and other immigration law enforcement skeptics insist that this attention is misplaced. They cite academic research claiming that immigrants actually are less prone to crime than natives.
This report explores the question of immigration and crime and finds that there is very little conclusive data to inform the well-entrenched views on both sides of the debate. We reviewed the major academic and government reports on the topic and found that these studies lead to contrary conclusions about immigration and crime. Moreover, the crime or incarceration data that do exist often are of limited value because they are unrepresentative in some way. It is also difficult to conclude much about crime associated with legal immigrants versus illegal immigrants. However, there is some indication that illegal immigrants have relatively high rates of crime, while legal immigrants have relatively low rates of crime.
In this report we use the words immigrant and foreign-born interchangeably. The foreign-born or immigrants are defined as persons living in the United States who were not U.S. citizens at birth.1 The foreign-born include non-citizens, both legal and illegal, as well as naturalized American citizens. The report is divided into three main parts: The first is a general discussion of why it is so difficult to study this question. Next, we focus on prior research that examined this question. In particular we focus on two recent studies that examined immigrant incarceration and the studies’ problems, particularly the lack of good data. Third, we examine new data that have become available as federal, state, and local governments have begun making a greater effort to ascertain and track the immigration status of criminal offenders. We also explore the limitations of this new data.
Difficult to Measure Criminality
Lack of Good Data. The problems that exist with regard to data on immigrant criminality will be discussed at length throughout this report. At this point it is important to understand that with the exception of federal prisons, which account for only a small fraction of all those incarcerated, state and local correctional institutions generally have not tried to carefully determine whether their prisoners are native or foreign-born. Typically they use self-reporting as the primary means by which they determine place of birth or citizenship. In recent years, prisons and even jails in some states have made a greater effort to collect this data. But often they merely ask prisoners themselves if they are foreign-born. Because being a non-citizen can lead to deportation, there is a strong incentive for individuals to lie about where they were born or if they are in the country illegally. This means that any survey such as the Census, or surveys done by jails and prisons, will likely understate the share of inmates who are non-citizens or illegal aliens if inmate data is not carefully checked against immigration records. Even checking against immigration records is problematic at times because there is no definitive list of legal U.S. residents (immigrants and native-born). And of course, there is no such list of illegal aliens. If someone has snuck into the country and has not had prior contact with immigration officials, that person’s fingerprints and other information will not be in any immigration database. By itself, then, a check of immigration records in such a circumstance would not contradict an assertion of U.S. birth.
Data for the general population collected by the Census or others surveys is reasonably accurate because, unlike inmates, the general population has much less incentive to lie. The problem applies specifically to those who are incarcerated. And even if good data exist because a jurisdiction has worked with the federal government to determine if inmates are immigrants (legal or illegal), the small number of jurisdictions that may have carefully collected information may not be representative of the country as whole, making it very difficult to generalize about immigrant criminality.
The absence of data on immigration status may be particularly relevant because much of the concern over immigrant crime is focused illegal aliens. But it is only part of the problem. Even if a correctional institution collects the information, it many not be available in a way that allows for a systematic analysis. For example, the California prison system has for some time tried to collect data on the place of birth for all its inmates. But the public-use data of the 2000 census shows that half the time the Census Bureau had to make an educated guess as to where institutionalized persons in California were born. So data were available from the state on this question, but did not make it into the hands of census takers. As will become clear throughout this report, the lack of good data systematically collected and made available looms as one of the most important impediments to studying immigrant criminality.
Immigrant Criminality in the Context of Race. In social science research, raw numbers need to be placed into some kind of context, often by comparing one population of interest to another. Assuming one can measure immigrant crime, the next question that arises is: To what should it be compared? This is an important question because crime rates among natives differ widely by group. For example, the share of native-born black men arrested or incarcerated is dramatically higher than for all other groups. If blacks are included in the data for natives, then the total arrest or incarceration rate for all natives is significantly higher. However, the discrimination and racism black Americans have experienced and the severe social problems that exist in some black communities make this population unique when it comes to the issue of crime. One can reasonably ask whether it makes sense to compare immigrants, who are overwhelmingly not black, to black Americans who have a unique historical experience.
Immigrant Criminality in the Context of Sex and Age. Crime rates and incarceration vary enormously by age. Adults under age 45, primarily men, commit most of the crimes in any society. When trying to determine whether immigrant crime is “high” or “low” there is the question of what age group should be used to make a comparison. For example, in 2007 immigrants were 12.6 percent of the total U.S. population, so it could be argued that if they are found to be more than 12.6 percent of inmates or criminals, then they might be seen as a source of increased criminal activity. On the other hand, immigrants comprise 15.4 percent of all adults and 17.6 percent of people 18 to 40. It could also be reasonably pointed out that immigrant crime data should be compared to their share of this crime-prone population. Even the age question is not as simple as it may seem, however, because while immigrants are a very large share of 18- to 40-year-olds, the group with the highest offender rate is actually 18- to 24-year-olds. Immigrants are only 11.7 percent of 18- to 24-year-olds — a smaller fraction than they are of the overall population.22
How one looks at this questions is partly dependant on what research question one wishes to answer. If you want to know whether immigration increases the overall crime rate, then immigrants’ or perhaps illegal aliens’ share of the total population may make for a more sensible point of comparison. But if one wants to know whether immigration creates a higher crime rate relative to their share of the crime-prone age group, then using this population as the benchmark may make more sense. Of course, one would need to define “crime-prone age group.”
Many of those who argue for high levels of immigration point out that one of its benefits is that immigrants are youthful and are therefore a larger share of workers than they are of the nation’s total population.3 One response to this observation is that immigrants are a larger share of workers because they are somewhat more likely to be of working age. The same could hold true for immigration and crime. Immigrants are somewhat more youthful and thus may increase the national crime rate.
Immigrant Incarceration in the Context of Demographic Lag. One final issue to consider when placing immigrant crime into context is the rapid growth of the immigrant population in many parts of the country. This problem looms large when it comes to those in prison. It must be remembered that a significant share of people in prison have been there for 10 or more years. In state prisons, for example, one-third of inmates have been in prison for more than five years and 15 percent have been there for more than 10 years.4 The rapid growth in the immigrant population is a very important issue when looking at states where the number of immigrants has increased dramatically in recent years. In 1995, for example, 3.7 percent of the Georgia population was foreign-born; by 2007 it was 10.2 percent.5 This means that immigrants will comprise a very small fraction of the state’s prisoners who are serving long sentences since immigrants were a very small fraction of the state’s population when those sentences were given out.
Ideally, it would be best to look at new arrivals to the prison system, if that data is available and can be compared to the current population of immigrants. Another possibility is to examine the average size of the immigrant population in a state over a long period. In other words, calculate the average share of the state’s population that is immigrant over the preceding 10 years and then compare this percentage to the current prison population that is comprised of immigrants. Trying to control for this “demographic lag” is not really necessary when looking at jail populations because jails are primarily composed of people awaiting trial or serving short sentences. As a result, most of those in jails have been there for one year or less.
Racism and Discrimination. As already discussed, some minority groups have much higher arrest and incarceration rates than whites. Some assert that this fact may reflect bias in the criminal justice system. This is also something to consider when studying immigrant crime. Immigrants are overwhelmingly minorities; their arrest or incarceration rates may be impacted by biases throughout the criminal justice system. Moreover, even if immigrants do commit a disproportionate share of crime, it is worth considering the role that prejudices may play in the larger society. This could be a function of racism rather than a problem with the immigrants themselves.
Crime over Generations. When thinking about immigration’s potential impact on crime, the long-term effect should be considered as well as the current effects. A recent study by the Immigration Policy Center (IPC) found that incarceration rates for native-born Hispanics are triple those of foreign-born Hispanics. And the incarceration rate of native-born Hispanics is much higher than for natives overall. As we will see, this study is based on data that are not reliable, but even if the data are correct, the question remains: Is this good news? Or perhaps more germane to the policy debate, does this mean that large-scale immigration has no implications for the nation’s crime rate? If the descendents of some immigrant groups currently arriving in very large numbers are more likely to commit crimes than the rest of the population, then large-scale immigration could be seen as causing an increase in crime in the long term even if the arrival of the original immigrant does not. How immigrant groups fare over generations may be as important to a discussion of crime and immigration as the crime rate of the original immigrant. However, given all the problems with census and other data, it may not be possible to produce good intergenerational analysis of incarceration.
Underreporting. For a variety of reasons, immigrants who are victims of crime may be less likely to report their victimization than native-born victims.6 This is important because most crime is intra-racial and intra-ethnic.7 If immigrants are less likely to report a crime, it is very likely that a large share of the crimes going unreported also are committed by immigrants. This would result in lower arrest or incarceration rates among immigrants when in fact their crime rates are actually higher. It would also create a situation in which crime rates seem lower than is really the case in immigrant communities or even cities where large number of immigrants settle. However, as we will see later in this report, it is very difficult to find good systematic evidence that immigrant crime is underreported.
Other Data Issues. The problem of trying to measure immigrant crime is compounded by what is sometimes referred to by immigration agents as the “brooming effect.” Prosecutors are known to sometimes drop pending charges against non-citizens once ICE indicates it will deport the alien, thereby sweeping the case off the prosecutor’s docket. This has the effect of reducing immigrant incarceration by some degree, as criminal aliens are removed from the country rather than tried, sentenced, and counted as part of the incarcerated population. Another factor complicating examinations of arrests and incarceration figures is that the removal of criminal aliens to their home countries reduces the chance that they will return and commit new crimes. While some deported immigrants do return illegally, deportations should reduce immigrant incarceration levels relative to natives, who cannot be deported and therefore can re-offend in the United States.
The number of criminal aliens deported in recent years is very large. In the last 10 years, 816,000 criminal aliens have been removed from the United States.8 As is often the case when it comes to immigration and crime, the data are difficult to interpret because DHS does not provide much detailed information about the crimes these individuals committed. However, the 816,000 figure does not include those whose only offense was living or working in the United States illegally.
Recent Studies Share a Major Flaw
Two recent and widely cited studies have tried to shed light on the question of immigrant criminality by analyzing public-use data from the 2000 census on persons in institutions. One study, by the Public Policy Institute of California (PPIC), is “Crime, Corrections, and California: What Does Immigration Have to Do with It”?9 The other study is “The Myth of Immigrant Criminality and the Paradox of Assimilation: Incarceration Rates among Native and Foreign-Born Men”10 and was sponsored by the Immigration Policy Center (IPC), a think tank created by the American Immigration Lawyers Association. Both studies were conducted by well-known researchers in the field. The general idea behind both studies is reasonable. While the public-use census files used in these studies do not distinguish between correctional institutions and persons committed to other facilities like nursing homes, by confining their analysis to younger men, the authors of both studies hoped to get a good idea of the immigrant incarceration rate. Both studies conclude that immigrants are much less likely to commit crimes than are natives. However, both studies share a fundamental problem: The data they use are not reliable, making meaningful analysis impossible.
Problems with Census Data
Long-Form Institutional Data Are Not Reliable. Although it is not well known outside of the Census Bureau, within the Bureau it is commonly acknowledged that long-form data for persons in institutions from the 2000 census are of extremely poor quality. Both the Census Bureau and the National Research Council, part of the congressionally chartered National Academy of Sciences, have examined decennial census data collected for persons living in institutions, and found enormous problems. The long form refers to the detailed information collected on roughly one-sixth of the population at the time of each census.11 All persons are asked the so-called short-form questions such as age, race, sex, etc. About 15 percent of the population was asked “long-form” questions, such as their place of birth, citizenship, income, use of social programs, etc. The short-form questions are much easier for the Bureau to collect for persons in institutions because there are fewer questions and the institutions are much more likely to know the information needed for the short form. Long-form information, such as country of birth and citizenship, is not tracked by most institutions in a systematic way for all inmates and made available to Census Bureau.
The Institutionalized Population. From the Census Bureau’s point of view, the U.S. population is divided into two main groups, those who live in households and those who live in “group quarters” (7.8 million in 2000). “Group quarters” refers to those in correctional institutions, military bases, college dorms, nursing homes, and other group settings. About half of those living in group quarters (4.1 million in 2000) are considered institutionalized. The institutionalized are those who live under formally authorized supervision or care, such as those in correctional institutions and nursing homes. The public-use data from the 2000 census allow one to examine the entire institutionalized population, but public-use data do not allow one to examine correctional institutions separately. Correctional institutions are grouped with other institutions like nursing homes in the public-use file. Both the PPIC and IPC studies confine their analysis to younger men, which is a reasonable proxy for those in correctional institutions. Of course, the approach used in the PPIC and IPC studies only works if the institutionalized data is of good quality. As we will see, this is clearly not the case.
Evaluations of Data Quality for Institutionalized Populations. There have been several attempts to examine the quality of the institutionalized data. One of the most detailed reviews of the 2000 census is The 2000 Census: Counting Under Adversity, by Constance F. Citro, Daniel L. Cork, and Janet L. Norwood and published by the National Research Council (NRC).12 The Census Bureau provided the NRC with information from internal data files that only the Bureau has access to. The results of the analysis show very significant problems with the long-form information gathered for persons in institutions. Data for the subset of those in prisons and jails was particularly bad.
One of the key problems with the institutionalized data is that the information needed to fill out the long form was often not available to the Census Bureau when the census was conducted. The NRC report found that when it came to determining whether a prisoner was immigrant or native-born, 53 percent of the time the Census Bureau had to make an educated guess. When the Bureau makes an educated guess it is said to “allocate” the missing information. In some contexts the term “imputed” or “assigned” is used for the process of filling in missing information. Given this level of allocation, the PPIC and IPC studies are essentially measuring the Census Bureau’s guesses rather than the actual incarceration of natives and the foreign-born. This problem is compounded by the fact that both the PPIC and IPC studies ran cross-tabulations by other variables, such as educational attainment and county of birth, yet the NRC study found that more than half the time the values for those variables were also allocated.13 It must be remembered that the overall census does not suffer from these problems; only those in group quarters or institutions are subject to extremely high allocation rates, with the data for those in jails and prisons being particularly poor.
For all persons in group quarters, the Bureau had to make an educated guess on the citizenship question 36.5 percent of the time in 2000.14 Thus all of the group-quarters data in 2000 was of very poor quality with regard to this question. But the 53 percent allocation rate for prisoners was even worse.
As bad as the problems with the 2000 census institutionalized data seem, it may actually be somewhat worse than the number above implies. An internal analysis conducted by the Census Bureau found that only 19.7 percent of persons in correctional institutions even filled out a census form or were interviewed by a Census Bureau employee.15 Instead, the Bureau relied on the cooperation of institutions to provide whatever administrative data was available. This suggests that even for the 47 percent of prisoners who did not have the citizenship question allocated, the information may be questionable, because it did not come from the prisoners themselves. Of course, asking inmates whether they are immigrants is also problematic because if they are non-citizens, they may be reluctant to admit it for fear of being deported. This creates a very strong incentive for inmates to say they are native-born in any survey, even though in the case of the census, the information would not be used to identify inmates for deportation.
It is worth noting that these problems were not as great for persons in institutions for short-form information. The NRC study found that the allocation rate for sex was 2.7 percent for prisoners, for race it was 5.4 percent, for age it was 5.5 percent, and for ethnicity (Hispanic) it was 11.8 percent. This compares to the 53 percent for whether they were foreign- or native-born. In short, the race and age data for the institutionalized population are of much better quality than the long-form data.
How the Bureau Makes Educated Guesses. When a question on the census is unanswered, the Bureau has several ways to fill in the missing information. The first is what is called a logical edit. Missing information is filled out based on other information that is available from the same respondent. So, for example, if someone is 10 years old and no information was recorded on whether he or she held a job, that person is assumed to not work because people in that age group almost never work. If logical edits are impossible, the Bureau uses a procedure called “hot decking.” An automated search is done for a “donor” record that shares key characteristics with the record that has missing information. The information from the donor record is used to fill out the missing information on the recipient record. The basic assumption is that if an individual had completed the census he or she would have filled it out in a similar fashion to those for whom there was a completed form. Of course, in the case of an inmate, the donor record may also have been filled out based on whatever administrative data were available rather than an actual interview.
If hot decking is not possible, the Bureau moves to a “cold deck” allocation. This method assigns the missing information based on a pre-determined distribution. As reported above, 53 percent of the time the Bureau had to use one of these allocation procedures for the foreign-born question when the person was in prison. The enormous share of prisoners who had the foreign-born question allocated is a clear red flag that very significant problems exist with the data. It might be possible to get some idea of whether someone is foreign-born if information was available on what country a person was born in. However, the NRC study also found that 54 percent of the time the person’s country of birth was also not available and had to be imputed. This is very similar to the 53 percent allocation rate for citizenship. So, when it came to the citizenship question, the Census Bureau was not able to fill in missing information using other information on the same questionnaire. Instead, it had to resort to hot or cold decking. Together, these problems result in data that cannot be used to examine the incarceration rates of immigrants. This become even more clear when we examine the results of the data.
Change in Populations Make Little Sense. Table 1 reports the size of the overall immigrant and institutionalized populations in 1990, 2000, and 2007. (The 2007 data were not included in either the IPC or PPIC studies.) The bottom of the table examines men ages 18 to 39 because this was the primary focus of the IPC study, which examined the country as a whole. Table 2 reports the same information for California, except that the bottom of Table 2 examines men ages 19 to 40, not 18 to 39, because this was the primary focus of the PPIC study. The figures for 2000 match the IPC and the PPIC studies. Both tables show a massive decline in the institutionalized immigrant population between 1990 and 2000 and then a dramatic rise in 2007. This is true of both the overall institutionalized immigrant population and of young male immigrants in institutions, who are likely inmates in prisons and jails.
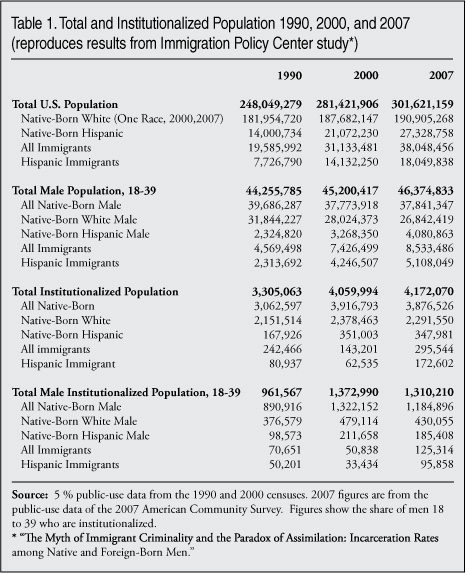
The focus of the IPC study was institutionalized men 18 to 39. The bottom of Table 1 shows these men in 1990, 2000, and 2007. The data show a 28 percent decline in the number of incarcerated immigrants from 1990 to 2000 — yet, the overall immigrant population grew 59 percent over this period. Between 2000 and 2007, Census Bureau data show a 146 percent increase in immigrant incarceration — yet, the overall immigrant population grew only 22 percent.
The most likely explanation for these wild and implausible swings is the poor quality of the census data used in the PPIC and IPC studies. Of course, if the data are correct, it means immigrant incarceration fell dramatically in the 1990s while the overall immigrant population grew enormously. But then after 2000 the number of incarcerated immigrants exploded, while the overall immigrant population grew much more modestly.
If true, the national figures indicate we are in the midst of an immigrant crime wave. The roughly 74,000 increase in incarcerated immigrants in just seven years is larger than the entire incarcerated population of slightly less than 51,000 in 2000. But actually, the recent change in the numbers reflects the enormous problems with the underlying data and almost certainly bears no relationship to reality. They are especially implausible in light of the enormous problems the Bureau has had in collecting good data on persons in prisons.
Citizenship of Incarcerated Immigrants Was Misallocated. Data from the American Community Survey (ACS) for those in institutions has not been examined to the extent that the 2000 census has, but ACS staff feel certain that the quality of group quarters data that has been collected in the last few years is much better than the 2000 census.16 As the quality of the data improved, the size of the foreign-born population in institutions grew dramatically between 2000 and 2007. This is an indication that the bias in the imputation techniques dramatically reduced the size of the institutionalized foreign-born population in the 2000 census. In particular, Table 1 implies that a significant number of institutionalized foreign-born Hispanic men in 2000 were wrongly imputed to be native-born Hispanics. The table shows that the number of incarcerated native-born Hispanic men fell 14 percent between 2000 and 2007, but the number of incarcerated foreign-born Hispanic men nearly tripled.
It should be recalled from the prior discussion that the Census Bureau was able to gather data for short-form questions such as race and ethnicity much more accurately than long-form data like citizenship. Therefore, the overall number of incarcerated Hispanics (both immigrant and native) does not fluctuate that much between 1990 and 2000 and 2007 the way the immigrant numbers do. Instead it goes up right along with the overall Hispanic population, as would be expected.
In short, it seems that many foreign born-persons in institutions were imputed as natives with the result that the number of immigrants incarcerated was significantly understated. As we will see, this problem almost certainly existed in the 1990 census as well. And it may exist in the 2007 American Community Survey. But it seems clear that the problem in 2000 was the most severe.
What About the 1990 Census? The NRC study discussed above also examined the institutionalized and prisoner populations in the 1990 census, although 1990 was not the primary focus of the study. The results show very significant problems with the 1990 data. For the citizenship variable used to determine whether someone was foreign-born, the NRC study found that 24.7 percent of the values were allocated for prisoners. That is, the Census Bureau had to make an educated guess as to whether the respondent was an immigrant about a fourth of the time. For a person’s country of birth, the allocation rate for prisoners was 31.7 percent. Again, these rates were produced for the NRC using the Census Bureau’s internal files that allow one to calculate the true allocation rate. Outsiders typically do not have access to this information. It is worth noting that the lower imputation rate resulted in a much larger institutionalized immigrant population in 1990 than 2000. Like the 2007 data discussed above, this strongly implies that the imputation method used significantly understates the size of the immigrant population in institutions. The more imputations, the smaller the foreign-born population and vice versa.
While the 24.7 percent allocation rate for the citizenship question and the 31.7 percent rate for the country of birth are not as bad as the 54 percent and 53 percent rates in the 2000 census, they are still extremely high. The very high allocation rates for the foreign-born and country of birth questions mean it is unwise to use the 1990 census to study immigrant crime. The fact that the size of the problem is not consistent between 1990 and 2000 also makes any comparison between those years unsound.
Immigrant Detention and Incarceration. As ICE has stepped up enforcement in recent years, more immigrants have been detained. The total number of those detained by ICE for immigration offenses in all facilities (including private facilities and local jails) grew from 19,528 in 2000 to 30,431 in 2007 — an increase of 10,903.17 Could this account for the seeming growth in incarcerated immigrants between 2000 and 2007? Table 1 shows that the increase between 2000 and 2007 in young (18 to 39) institutionalized immigrant men was 74,476. Thus, immigration enforcement could only account for a small fraction of the increase in the number of institutionalized young men between 2000 and 2007. It should also be noted that many of those detained by ICE are women, children, or men over age 39, so they would not be included in the analysis of Census Bureau data in Table 1.
Incarceration Rates. Table 1 can also be used to calculate incarceration rates. Table 1 shows that the institutionalization of young immigrant men in the United States in 2000 was 0.7 percent, and in 2007 it roughly doubled to 1.5 percent. If true, this implies a dramatic increase in immigrant incarceration and criminality. In reality, these figures simply reflect underlying problems with the data.
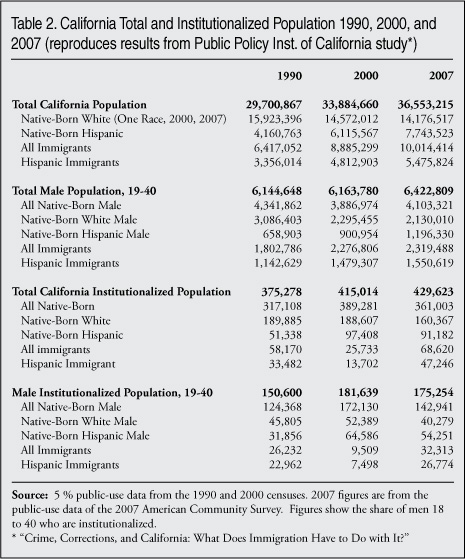
The PPIC Study and California. Table 2 shows the same basic information as Table 1, except that it is for California. The PPIC study examined 18- to 40-year-old men using the 2000 Census, so Table 2 does the same. The results in Table 2 are as implausible as the national figures shown in Table 1. They show that between 1990 and 2000 the overall immigrant population in the state grew 38 percent, yet the number of institutionalized young immigrant men (18 to 40) fell 64 percent from 26,232 to 9,509. Table 2 also shows that between 2000 and 2007 the overall immigrant population in the state grew 8 percent, but the number of institutionalized young immigrant men grew 240 percent.18 As was the case in the IPC study, the changes from 1990 to 2000 and from 2000 to 2007 are completely out of line with the increase in the overall immigrant population. It is improbable in the extreme that the number of immigrants in California’s prisons and jails collapsed in the 1990s and then suddenly exploded in the first seven years of this decade. We believe that these wild swings must reflect the underlying problems with the data and nothing more.
We get the same results if we examine incarceration rates. Based on Table 2, the institutionalization rate for young immigrant men in California in 2000 was 0.4 percent. But in 2007 it was 1.4 percent — more than triple the 2000 rate. Interestingly, the data also show that for young Hispanic immigrant men the incarnation rate went from 2.0 percent in 1990 to 0.5 percent in 2000 and then back up to 1.7 percent in 2007. As with the national data in Table 1, when the imputation rates are lower, as in 1990 and 2007, the Hispanic immigrant incarnation rates are higher. But when the Census Bureau had to make more guesses, the rates are much lower. At the same time, native-born Hispanic men move in the opposite direction. This again strongly suggests that the bias in the imputation method used by the Bureau misallocates native-born Hispanics as immigrant Hispanics creating artificially low rates of immigrant incarceration.
Why Did the PPIC and IPC Use Bad Data? The most likely explanation for why the authors used such poor quality data is that they simply did not know about the problems. The enormous problems with long-form data gathered on persons in institutions from the 2000 census are not well known outside of the Census Bureau. To an outside researcher, the only clear indication of the problem with the data is the massive decline between 1990 and 2000 in the institutionalized immigrant population mentioned above. (Data for 2007 may not have been available to the authors at the time of publication.) It is worth noting that the Immigration Policy Center is funded by the American Immigration Lawyers Association, a major advocacy group for high levels of legal immigration and a legalization/amnesty for illegal aliens. It is simply human nature to be less questioning of results that comport with one’s preexisting assumptions. The PPIC has a more neutral position on immigration, but in general its published research points to the benefits of immigration, not the costs. Moreover, the lead researchers of the PPIC have argued for a number of years that immigrants have low rates of incarceration. And this, too, may have made them less questioning of results that should have struck them as odd at best and far fetched at worst. But it should be pointed out that both sets of researchers are well respected in the field and there is absolutely no indication that they knew of the problems.
It is possible that the institutional immigrant population might grow somewhat faster or slower than the overall immigrant population. But a massive decline in the institutionalized immigrant population at a time of record growth in the overall immigrant population is simply not believable.
There is one other defense of the researchers that should be made. In theory they could have looked at the imputation rates in the public-use data. The public-use data include a variable that reports whether the value for a particular question was imputed. Imputed means that information was missing and was filled in by the Census Bureau using one of the methods explained earlier — logical edit, hot decking, or cold decking. But for the citizenship question even the most conscientious researcher could not have discovered the huge problem with institutionalized data because of the unusual way the Census Bureau uses the concept of imputation in the public-use file.
In the public-use file, the Bureau seems to have considered a response imputed only if it was the variable that caused the hot or cold decking. But most of the time citizenship was not the triggering variable. Instead, a blank answer to the country of birth seems to have been the question that caused the allocation procedure, which is automated. As will be recalled from the explanation of hot decking, once a donor case is found, the values from that donor case are used to fill in the missing information in the recipient case. The public-use file of the 2000 census shows the citizenship variable was imputed for persons in institutions only 0.7 percent of the time.19 The internal files from the census analyzed in the NRC study found the actual imputation rate for prisoners was 53 percent. Though very confusing, the intention of the Bureau is not to deceive those using the public use file of the 2000 census. But the decision to report things in this way makes it almost impossible for a researcher to evaluate data quality and realize that the citizenship questions for those in institutions are comprised mostly of allocated responses, or what a layman would call guesses.20
Other Research
While the PPIC and IPC studies are often cited and are two of the more recent studies on immigrants and crime, they are by no means the only studies to examine the issue. There has actually been a good deal of effort over the last century to study this issue. As pointed out at the outset of this Backgrounder, most prisons, jails, police, and prosecutors generally do not track the citizenship, country of birth, or legal status of those who move through the criminal justice system in a systematic way that is made public and can be readily analyzed by researchers. While it turns out that the institutionalized data from the 1990 and 2000 censuses are faulty, the reason for using the decennial census data was partly an attempt to get around the lack of good representative data. However, there are other ways to approach this question. Below we examine some of the research on immigration and crime, focusing mainly on the more recent work. While we do not claim to have surveyed the entire literature, we do try to explore the main findings on immigration and crime. In general, this older research found little or no evidence that immigrants are more likely to be associated with criminal activity
Historical Research. During the last great wave of immigration around the turn of 20th century the issue of crime and immigration was studied. Although information was limited and results uneven, in general researchers found little support for the perception that immigrants commit a disproportionate share of crime.21 However, this older research is not particularly relevant to the current situation for a variety of reasons. Immigration policy has changed dramatically, the primary immigrant-sending countries have changed, and the United States itself has changed over the last century in innumerable ways, from its legal system to its economy. Moreover, today there is substantial illegal immigration, which was not a major concern in the past. While these old studies may not shed any light on the situation today, they do serve to remind us that simply because there is a perception that immigrants have high crime rates does necessary mean that the perception is correct.
National Immigration Levels and Crime Rates. Several studies have pointed to the fact that the nation’s crime rate has generally fallen since the early 1990s, while the immigrant population has grown significantly. Both the PPIC and IPC studies, for example, cited this trend in support of their overall conclusion that crime rates are low among immigrants. The IPC study even goes so far as to argue that “immigration is arguably one of the reasons that crime rates have dropped in the United States over the past decade and a half. Indeed, a further implication of this evidence is that if immigrants suddenly disappeared and the country became immigrant-free (and illegal-immigrant free), crime rates would likely increase.”22 But it must be remembered that the national crime rate statistics referred to in the IPC study are for all persons, not for immigrants or natives specifically. Because native-born Americans accounted for seven out of eight U.S. residents in 2007 and more than nine out of 10 for most of the 1990s, native trends in crime will be the overwhelming determinate of the nation’s overall crime rate. Thus the recent fall in crime rates coupled with the growth in the immigrant population is not evidence that immigration lowers crime rates or that immigrants have low rates of crime. With aggregate-level data, all that can be said is that as the immigrant population increased after 1994, the nation’s overall crime rate fell. It is also possible that immigrants have high crime rates and as their population grew their high crimes were masked by a decline in crime committed by natives.
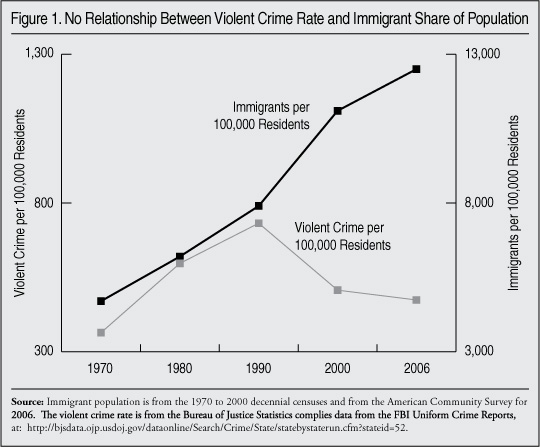
Figure 1 shows that the 1970s and 1980s were a period of very rapid increase in the immigrant share of the population and also a dramatic increase in the national crime rate. It is certainly correct that the national crime rate fell in the 1990s and the early part of this decade, while the immigrant population continued to grow dramatically. But crime is a very complex social phenomenon. Researchers have cited a number of reasons for the decline in crime in the last decade and a half. These reasons include a generally strong economy, new methods of policing, an enormous growth in the incarcerated population, a large increase in the number of police, a stabilization of drug markets, and a fall in the size of the crime-prone age group (young men).23 The bottom line is that increasing immigration has coincided with both periods of rising crime and periods of falling crime. This could mean that immigration lowers crime, immigration levels are irrelevant to the crime rate, or that other factors mask the harmful effect of immigration on crime. Analysis of the combined (immigrant and native) national crime rate is not of any real help in understanding the issue of immigrant criminality.
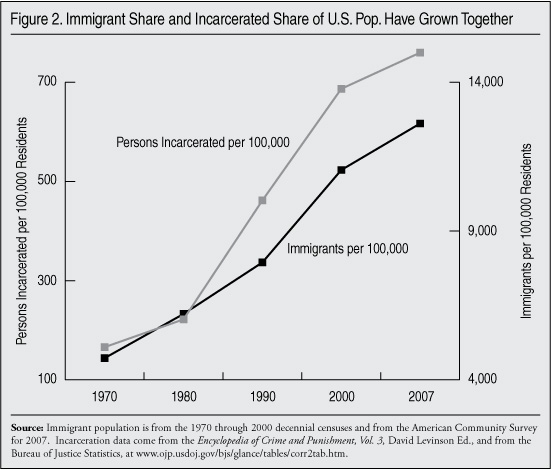
This same problem exists with incarceration rates. The nation’s incarceration rate has increased almost proportionately with the level of immigration for nearly four decades. Figure 2 shows that from 1970 to 2007 the increase in the immigrant share of the overall population paralleled the increase in the share of the incarcerated population. So it would be correct to say that the share of the population incarcerated went up as immigrants became a larger share of the overall population. But like the above discussion of the combined crime rate (immigrant and native), the combined incarceration rate is of no real help in understanding any possible link between immigration and crime.
National Bureau of Economic Research. Kristin Butcher and Anne Morrison Piehl, lead authors of the PPIC study, also published a National Bureau of Economic Research (NBER) study that examined why immigrants seem to have low incarcerations rates.24 The authors developed a model that argues that immigrants are self-selected to be less likely to commit crime. But the underlying problem is that the analysis is primarily based on the size of the institutionalized population from 1980 through 2000 in the decennial censuses. As we have seen, there is overwhelming evidence that the 1990 and 2000 censuses cannot be used for this purpose because the institutionalized foreign-born or immigrant population is not properly identified in these data.25
Cross-City Comparisons. A number of studies have tried to find a link between immigration and crime by comparing immigration levels and crime levels across different cities. Another study by Butcher and Piehl compared changes in crime rates across 43 metropolitan areas from 1981 to 1984 and from 1986 to 1990. They found that cities with larger immigrant populations do have higher crime rates. But when they controlled for other factors, such as the composition of a city’s population, they found that immigration had no impact.26 The PPIC study also includes a simple analysis of cities in California and their crime rates, which finds that an influx of immigrants between 2000 and 2005 was associated with a decline in overall crime rates. The 1994 U.S. Commission on Immigration Reform compared crime in American cities on the Mexican border to crime in non-border cities and found that crime rates in border cities were generally lower than rates in non-border cities.27 Another study done for the Commission on metro areas in the southwest came to the same conclusion.28 An analysis of crime in border cities, which tend to have high immigrant populations, found that crime rates fell faster through 2001 than in the country as whole.29 These cross-city comparisons seem to offer some of the best evidence that immigration does not lead to an increase in crime. However, cross-city comparisons do not always show immigration’s impact. A February 2009 report by the Department of Homeland Security’s Office of Immigration Statistics found that, on average, crime rates were higher in metropolitan areas with the most growth in their legal immigrant populations.30 While useful, comparisons across cities suffer from some significant problems.
Problems with Cross-City Comparisons. One key limitation of the approach used in cross-city comparisons is that, in general, they only measure crime in the overall population — not crime by immigrants specifically. It is possible that crime in a city is high among immigrants and low among natives, creating an average level of overall crime. It should also be pointed out that for all races and ethnic groups, most crimes are committed by less-educated men. Immigrants are much less educated than natives on average; in 2007, for example, 29 percent of adult immigrants (legal and illegal) had not completed high school compared to 7.5 percent of adult natives.31 So if immigration increases the number of less-educated men, the result could be a higher crime rate.
Further, if immigration impacts the migration of less-educated natives then it makes cross-city comparisons more difficult. If immigrants cause less-educated natives to leave an area over time, then the overall population of less-educated adults will remain unchanged in a particular city.32
An additional issue to keep in mind with any cross-city comparison is that unlike simple comparisons of incarceration or arrests rates, examinations of cities using various statistical methods always hinge on what variables are put into the equation. This does not make such studies invalid; in fact analysis of this kind is extremely common in the social sciences. But it does make this type of analysis heavily dependent on the variables researchers choose to use.
Another potential problem with comparisons between cities is that they are only measuring reported crimes. As discussed below, most crime is intra-ethnic, thus a large share of the victims of immigrant crime are other immigrants or native-born co-ethnics. If immigrants or particular ethnic groups are less likely to report crimes, then it could create a seemingly lower overall crime rate in an immigrant-heavy city than is really the case.
The Reporting of Crime. The Bureau of Justice Statistic’s National Crime Victimization Survey (NCVS) was created in part to better measure crime and the share of victims who were not reporting crimes to police. Unfortunately, the survey does not distinguish between immigrants and native-born Americans. But it does show the share of crimes reported by Hispanic victims (immigrant and native). Looking at Hispanics can provide some limited insight into whether immigrants are less likely to report crime. More than half of all adult Hispanics are foreign-born, and more than half of all recent immigrants are Hispanic. The NCVS from 2006 shows significant differences between the share of Hispanics and non-Hispanics who report a crime. Of Hispanics who reported being a victim of a violent crime, the NCVS showed that 41.3 percent reported their victimization to police. In contrast, 50.1 percent of non-Hispanic victims reported the crime. For all personal crimes, 41.6 percent of Hispanic victims reported the crime to police compared to 50.3 percent of all non-Hispanic victims.33 This means that in that year Hispanic victims were about nine percentage points or 21 percent less likely to report their victimization than were non-Hispanics. This could significantly impact the rate of reported crime in high-immigrant areas and create the illusion that crime is significantly lower than it really is. However, the NCVS does not produce consistent results on this question over time; in some years, Hispanics are more likely to report crime. Moreover, the NCVS does not distinguish whether the victim is immigrant or native; nor does it distinguish whether the perpetrator was immigrant or native. Other research on the issue of underreporting of crime has come to conflicting conclusions.34 Thus it is very difficult to conclude that crimes committed by immigrants are going unreported.
Survey of Inmates. The Survey of Inmates in State and Federal Correctional Facilities collected by the Bureau of Justice Statistics asks inmates in the nation’s prisons if they were born outside of the United States. The public-use data from 2004 are available, and show that 8.1 percent of those in state prisons report that they are foreign-born. But the survey relies primarily on self-reporting and the information is not verified. As discussed earlier, some foreign-born inmates might be claiming U.S. birth. Still, the survey supports the other research that immigrant incarceration is relatively low in state and federal prisons combined.
The FBI’s Most-Wanted Murderers. The FBI maintains a list of most-wanted murderers. This list is relevant to the debate over immigrant criminality because the FBI compiles a detailed profile of each individual on the list and makes it public. In almost every case the list includes the fugitive’s country of birth. In the spring of 2009 there were 76 individuals on this list, 73 of whom had a country of birth listed. Of the people on the list, 43 individuals (57 percent) were born outside of the United States. If we use only those for whom their country of birth was known as the denominator (73), then 59 percent were foreign-born. The overwhelming majority of foreign-born murderers (35) were born in Mexico.35 While the information is almost certainly very accurate, it is of limited use in trying to understand immigrant criminality because it is only one small category of criminals. It is also important to understand that it is not a list of the worst murderers in the country; rather it is a list of the most-wanted fugitive murderers in the country. Foreign-born individuals can more readily flee to other countries where they have existing ties, making them more likely to end up on a list of fugitives. Nonetheless, the extremely large share of these murderers who are immigrants is troubling. As will be recalled, only 15.4 percent of the adult population is foreign-born. The fugitive murderer profiles are an indication that immigrant crime may not be as low as some researchers have argued.
Manhattan Institute Research. Manhattan Institute researcher Heather MacDonald concludes that “some of the most violent criminals at large today are illegal aliens.” One of the conclusions of her work is that out of a fear of offending powerful immigration advocacy groups, some police are inhibited from carefully tracking illegal alien crime or trying to use immigration enforcement to disrupt illegal alien criminal activity. This likely contributes to the lack of good data on immigrant crime. She finds some evidence that illegal aliens represent a disproportionate share of fugitive criminals. She reports that, in Los Angles County, 95 percent of all outstanding warrants for homicide are for illegal aliens and up to two-thirds of fugitive warrants in the county are for illegal aliens. While her work does not present systematic evidence of illegal immigrant crime, it does illustrate that illegal alien crime is not trivial. Moreover, she makes a strong case that by avoiding immigration issues, local police are failing to use an important tool at their disposal to reduce crime.36
Center for Immigration Studies Findings on Gang Violence. In a 2008 study funded by the Justice Department, the Center for Immigration Studies found that 25 to 50 percent of gang members arrested in northern and western Virginia were removable, and usually illegal, aliens. The sources of the data used in the study were law enforcement agencies in Virginia, including the Northern Virginia Gang Task Force. The population of removable aliens consists largely of illegal aliens, but also those legal immigrants who commit a certain level of crime. Therefore, the population of deportable aliens is a smaller subset of the population of non-citizens. In the northern Virginia jurisdictions that were the subject of the study, non-citizens comprise at most 15 percent of the total population based on the latest Census Bureau data. In western Virginia, non-citizens are a much smaller fraction of the overall population. Thus the study’s results indicate that when it comes to gang-related crimes, non-citizens clearly represent a disproportionate share of criminals in parts of Virginia. However, it must pointed out that the study did not provide systematic evidence for areas outside of Virginia and analysis is limited to only gang-related crime. Like the Manhattan Institute article cited above, the authors of the CIS report make clear that immigration enforcement is an effective tool to reduce gang-related crime in areas where a large share of gang members are either non-citizen and/or illegal aliens.37
Pew Hispanic Center Study. A recent Pew Hispanic Center study, “A Rising Share: Hispanics and Federal Crime,” presents selected data from an analysis of the race, ethnicity, and citizenship of sentenced federal offenders in 2007 using data from the U.S. Sentencing Commission.38 The analysis focuses on Hispanics, comparing offenses of citizen and non-citizen Hispanics, whites, and, blacks. According to information in the report, non-citizen Hispanics accounted for 29 percent of all federally sentenced offenders in 2007. This figure includes those sentenced for immigration offenses, of which 74 percent were non-citizen Hispanics, as might be expected. Information in the report also indicates that 25 percent of those sentenced for drug crimes were non-citizen Hispanics. In comparison, Hispanic non-citizens comprised only 5.1 percent of the nation’s total adult population in 2007, based on the public-use file of the 2007 American Community Survey. Using data in the report, it is also possible to estimate the Hispanic non-citizen share of white collar and firearms offenders. Eight percent of the white collar/fraud offenders and 6 percent of firearms offenders were Hispanic non-
citizens.
Problems with the Pew Study. This study provides only a small shapshot of the criminal population, namely those sentenced in federal court. Moreover, data on Asians and other smaller ethnic groups were largely left out of the study. Nevertheless, the findings are interesting, because the study breaks out the population of non-citizen Hispanics, which is a large sub-set of the total immigrant population.
New Government Data
In recent years ICE has worked harder to identify the foreign-born, particularly illegal aliens and other deportable non-citizens who are inmates in the nation’s prisons and jails. In addition, a number of state and local governments have recently begun working with ICE under various programs to identify deportable non-citizens in their jurisdictions. Some data are also available on incarcerated illegal aliens from the State Criminal Alien Assistance Program (SCAAP). From these and other sources, the Department of Homeland Security and ICE have for the first time developed estimates of the total incarcerated foreign-born and non-citizen removable population. Much of this new data contradicts the earlier academic research by showing high rates of crime and incarceration among immigrants, particularly illegal aliens. However, this new data is not without problems.
Information from the 287(g) Program. Section 287(g) of the Immigration and Nationality Act allows certain specially trained and supervised non-federal law enforcement officers to access immigration databases to check the immigration status of foreign nationals they encounter and, if appropriate, to charge foreign nationals with immigration violations and transfer them to ICE custody. Although the 287(g) program was authorized in 1996, few jurisdictions took advantage of this program until about 2006. Because current demand for the program is so great and the approval process is complicated, sometimes ICE will conduct an audit of the jurisdiction’s jail population to determine the likely caseload and to help them prioritize the jurisdictions to receive the authority.
The 287(g) program has been valuable from a research perspective because we now have reliable data for some jurisdictions on the immigration status and/or citizenship of individuals arrested or jailed. As part of a separate study on the 287(g) program, we obtained information from several jurisdictions on individuals charged with immigration violations under 287(g) authority, and then placed those statistics into demographic context based on additional information from the jurisdictions.39
Table 3 reports our results. We have included 10 jurisdictions where we were able to find complete information that can be compared with the general population. It is important to note certain idiosyncrasies with the data that greatly limited the number of localities we could study in a systematic way. For example, it was not possible to include some localities in the table because the only information that was available was the number of ICE detainers or holds on inmates. In these cases, ICE does not want the prisoner released because they intend to remove the person from the United States. But ICE has limited resources and does not try to remove all, or even most, illegal aliens or non-citizens that are identified in a jail. Thus the number of “holds” only tells us the number of prisoners considered to have committed crimes serious enough to met ICE’s criteria for a hold. To place such a number in context we would need to know what share of the total prison or jail population falls into that same category. This information is, of course, not available because no agency makes such a determination for native-born Americans or naturalized citizens.
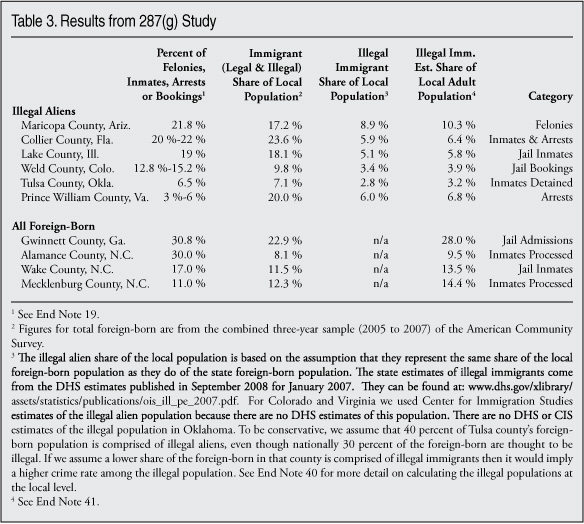
The information in Table 3 comes from a variety of sources.40 The top portion of the table shows illegal aliens and the bottom shows all foreign-born. The counties are divided based on what information we were able to obtain. The first column of the table shows the share of jail inmates or arrestees or bookings (each jurisdiction reports different information) that are either comprised of illegal aliens or the foreign-born. The second column is the share of the county’s population comprised of immigrants based on the best data available from the Census Bureau.41 The third column shows the estimated share of the local population that is comprised of illegal immigrants. Column four shows the share of adults in each county that is comprised of illegal aliens or immigrants overall. Immigrants (legal or illegal) comprise a larger share of the adult population than they do the overall population because both legal and illegal immigrants generally come as adults. Although there are many children in illegal immigrant families the overwhelming majority are U.S.-born and thus are not immigrants. Comparing immigrants who come into contact with the criminal justice system with their share of the local population should provide some idea of whether immigrants have a “high” or “low” crime rate.
The top portion of Table 3 shows that illegal aliens comprise a very large share of those who come in contact with local law enforcement in most of these communities. This is not surprising since all of these communities are places where illegal immigration has become a significant concern. Whatever the illegal immigrant or overall foreign-born share of the local population, the fact that illegal aliens are one-fifth of felons in Maricopa County and about one-fifth of jail inmates in Lake County is very troubling. It is also worrisome if, as shown in the lower portion of the table, immigrants are also about one-third of those in jail in Gwinnett and Alamance Counties. For most of these communities, the impact on crime would appear to be significant. When we try to place the illegal figures into a demographic context there are clear indications that immigrant incarceration is high in some of these communities.
Nationally, DHS, the Pew Hispanic Center, and the Center for Immigration Studies all estimate that slightly less than one-third of the overall immigrant population is in the country illegally. The estimates for the illegal population in the table are primarily based on state-level estimates from DHS.42 Based on the best information we have, illegal aliens seem to be a larger share of those arrested or jailed than they are of the overall county population in almost every county listed. This is also the case when we compare them to their estimated share of the adult population.43 Prince William County would seem to be the exception in Table 3. In that county, illegal immigrants do not seem to be coming into contact with law enforcement at rates higher than their share of the overall population.
Turning to the bottom of the Table 3, which reports data on the overall foreign-born population, we see that only in Mecklenburg County do immigrants appear to be underrepresented in the jail population, though they are still about one out of 10 inmates in the county. It could be that many of the foreign-born inmates are illegal aliens and that illegals are thus over-represented in the Mecklenburg jail, but we were not able to obtain that information. Also in Gwinnett County, the immigrant share of the jail population does not seem to be significantly out of proportion to their share of the local adult population. On the other hand, the fact that immigrants are almost one out of three inmates in Gwinnett County is likely to be a source of significant public dissatisfaction in that community regardless of whether this represents a disproportionate share of the local population. This is especially true if many are in the country illegally. Again, we cannot say if this is the case for Gwinnett County because information on legal status was not available to us. Overall, the limited results from the 287(g) program seem to contradict the idea that immigrants, at least illegal immigrants, have low rates of crime. Four out the six counties for which we have complete data show that illegals represent a disproportionate share of those arrested, jailed, or booked. When the overall foreign-born population is examined (bottom of Table 3) in the four counties for which we have information, the situation is more ambiguous. This might be because illegal immigrants have high rates of incarceration, while legal immigrants have low rates. The results in Table 3 are consistent with that possibility.
Problems with Data from the 287(g) Program. The first and most important problem with trying to analyze 287(g) data is that we have complete information for only 10 counties, out of more 3,100 counties and hundreds of cities that also run jails. It is not clear whether the counties in Table 3 are even representative of the country. To be enrolled in the 287(g) program a county has to first demonstrate to ICE that there is a problem with illegal alien crime in the community. This could create bias because only those communities where illegal aliens are suspected of committing a large share of crime are enrolled in the program or have had an audit done by ICE. Of course, 287(g) communities do typically have large immigrant populations, but they will not necessarily be communities where immigrants are committing crime out of proportion to their share of the population. While we believe our estimates for the local illegal populations are reasonable, they are only estimates. It is unlikely that the county estimates are far off the mark, because they are based on ACS and DHS figures. Even if two-thirds of the foreign-born in each county were illegal immigrants, it still would not significantly change the results in the top portion of the table. (Nationally, 30 percent of the foreign-born are illegal aliens.)
Another issue with the data in Table 3 is that there is still the problem of self reporting. Based on our investigations it seems that self-reporting does play some role in the process of identifying immigrants, including illegal immigrants under 287(g) and related efforts. Thus it is possible that some immigrants (legal or illegal) are still missed by the 287(g) program.44 However, the problem of false claims to U.S. citizenship is less likely in 287(g) programs than in other corrections data because the 287(g) booking officers are trained in how to interview foreign-born individuals and can more easily verify the information given because they have direct access to immigration databases. Finally it should be remembered that we are only examining the results from jails, not state prisons, where the worst criminals are housed.
Secure Communities Initiative. On November 19, 2008, ICE announced the launch of a new program, the Secure Communities Initiative, to identify and prioritize the removal of incarcerated criminal aliens. The agency issued a fact sheet reporting that it had identified 221,000 criminal aliens in the nation’s jails.45 Incarcerated criminal aliens who are potentially removable would include illegal aliens, lawful permanent residents, and temporary visa holders, such as guest workers and foreign students. It would not include immigrants who are naturalized U.S. citizens or legal immigrants convicted of minor crimes. Criminal aliens as a group include those who are foreign-born, but are not U.S. citizens. The new figures for this population, according to ICE, are triple the number it identified just two years earlier. Of course, the actual number of criminal aliens in jails has not tripled in recent years. Instead, for a variety of reasons, ICE is doing a much better job of identifying them. But this again highlights one of the problems associated with the older data on immigrants and crime — several years ago ICE did not know as much as it knows today about the size of this population.
In addition to the figures on criminal aliens in jails, the Secure Communities report included the agency’s estimate, made earlier in 2008, that the total number of criminal aliens detained in jails and prisons is 300,000 to 450,000. Table 4 was provided to the Center for Immigration Studies by the ICE Public Affairs Office. The table is an exact reproduction of the information from ICE (drawn from a larger report that we were not able to obtain) and reproduces the explanatory footnotes. It shows that ICE estimates that 20 percent of prisoners in jails and state prisons are foreign-born. The footnotes in the table indicate that the table was generated with data from 2005 through 2007. The foreign-born share of the overall U.S. population during this time period was 12.5 percent. The foreign-born were 15.3 percent of the adult population. These numbers imply a high rate of incarceration for immigrants (legal and illegal).
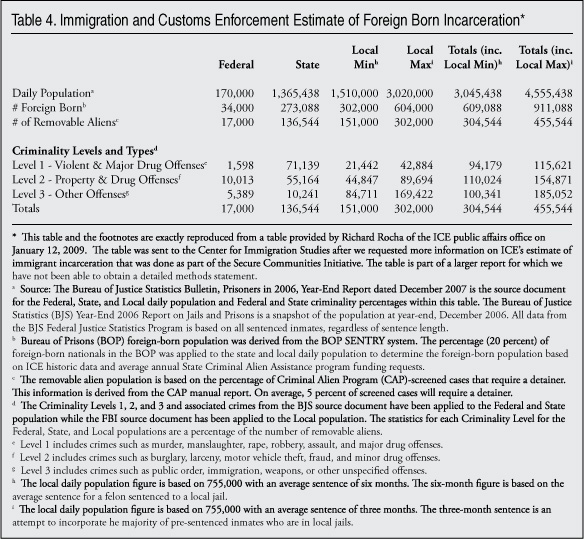
Table 4 also shows that removable aliens are 10 percent of the state prison population and 10 percent of the jail population. Again removable aliens are people in the country legally who have committed a crime severe enough to be removed from the country, plus all illegal immigrants. In Census data “removable alien” corresponds to non-citizen immigrants who have committed a major crime. In the 2005-2007 time period, non-citizens were 7.2 percent of the total U.S. population and 8.5 percent of the adult population. These numbers indicate that non-citizens were incarcerated at rates somewhat out of proportion to their share of the total population and the total adult population. But the numbers for the overall incarcerated foreign-born population are far out of proportion to their share of the total adult population. This conclusion tends to contradict the evidence from the 287(g) program, which shows that illegal aliens, not the overall foreign-born, are incarcerated or arrested at a disproportionately high rate. If illegals have the higher crime rates, then Table 4 should show that non-citizens have a high rate of incarceration because illegals are a sub-category of non-citizens. As mentioned above, non-citizens, including illegal immigrants, are 8.5 percent of the adult population so their 10 percent share of the prison and jail population is not that different. But naturalized citizens are only 6.7 percent of the adult population, so if they really are 10 percent of the incarcerated population as shown in Table 4, it indicates they are the part of the foreign-born with high rates of incarceration.46
Problems with the Secure Communities Estimate. The new ICE estimates could indicate high rates of criminality for immigrants overall. To the best of our knowledge it is the only estimate that the federal government has ever calculated for the size of the total immigrant population in prisons and jails. But the biggest problem with these numbers is that we have been unable to obtain a detailed methods statement explaining how ICE generated the estimates. The footnotes in the table, which we have reproduced exactly as they were provided by ICE, only provide a hint of how the figures were compiled. They state that the estimates come from the FBI Uniform Crime Reporting Program, the Bureau of Prisons SENTRY system, Criminal Alien Program, and the State Criminal Alien Assistance Program, along with “historic ICE data.” We do not know what extrapolation has been done to generate these estimates. They cannot be the result of cross tabulations from a database of names or they would not produce uniform results of 20 percent across the board for federal, state, and local institutions. Some estimation or extrapolation method must have been used. The 20 percent figure for the federal prison system itself is confusing because, as we discuss below, the Federal Bureau of Prisons reports that 26.4 percent of federal prisoners are not U.S. citizens and this has remained relatively constant in recent years. And in addition to non-citizens, some naturalized citizens are also incarcerated in federal prisons. So the overall foreign-born population in federal prisons must be higher than 26.4 percent.47
Based on Table 4 it is certainly correct to point out that the government claims that immigrants comprise 20 percent of the nation’s jail and prison population. And this is significantly larger than immigrants’ share of the adult population in the United States. While this implies a high incarceration rate, the estimation method used by ICE is largely unexplained, making it impossible to evaluate the accuracy of their estimates.
Fentress Study. In 2004, ICE contracted with Fentress, Inc., to conduct a study of the foreign-born population in state departments of corrections and local jail facilities across the country. The Fentress study seems to be the most extensive review of inmate records ever done to identify immigrants. The results suggest a high rate of immigrant incarceration.48
According to Fentress, they interviewed state and local jail facility representatives and extensively reviewed data sources provided by state prison systems and jails. According to the report, they received data directly from 36 state departments of corrections and 45 of the larger jails in the country. A total of 8,134,087 inmate admission records were reviewed, of which 1,766,341 were reported as foreign-born at booking; 1,032,166 contained either missing or indeterminate values for place of birth. This implies that 21.8 percent of inmates are foreign-born, but it could be higher since immigrant status could not be determined for over a million records. In 2004, only 14.7 percent of the nation’s adult population was foreign-born, so this would seem to indicate a relatively high immigrant incarceration rate.49 While the study seems extensive, there are significant questions about how much the study actually sheds light on the issue of immigrant criminality.
Problems with the Fentress Study. The main problem with the Fentress study, in the context of our purposes here, is that it covers only the largest jail systems with the largest immigrant populations, not every jail system in the country. In addition, several state prison systems with large immigrant populations, including California, Arizona, and Texas, did not provide Fentress with usable data.50 For those state prison systems that did not provide data directly to Fentress, the report relied on other means of estimating the foreign-born share of inmates. The purpose of the Fentress study was to project the future workload for ICE’s Institutional Removal Program. It provides estimates for the expected workload of alien screening and removals on an annual basis for each institution studied, but it does not provide the total number of immigrant inmates in each institution. If the Fentress report had included all the state and local totals that went into its count of 1,766,341 foreign-born inmates, then we could better place this number into a demographic context.
The Federal Prison System. The federal prison system is one of the only corrections systems that carefully tracks the citizenship of all those who are incarcerated. The data go back many years and all the evaluations show it is accurate and consistent over time. According to the Bureau of Prisons, as of July 25, 2009, 26.4 percent of the federal prison population was comprised of inmates who are not U.S. citizens.51 Since non-citizens comprised 7.1 percent of the total population and 8.4 percent of the adult population in 2009, this means that with regard to federal crimes, non-citizens have very high rates of criminality.52 There is no question that non-citizens comprise a disproportionate share of those in federal prisons. Thus it is reasonable to point out that federal prisons, the correctional institutions with the most accurate data, show that non-citizens are incarcerated at a high level. However, as will be discussed below, statistics from the federal prison system on criminal aliens may not be as meaningful as they may seem for the larger question of immigrant criminality.
Problems with Federal Prison Data. While data for those in the federal prison system are almost certainly the most accurate in terms of distinguishing American citizens from non-citizens, it is very difficult to draw any conclusion about overall immigrant criminality from the data. First, they only identify non-citizens (illegal immigrants, green card holders, and temporary visa holders). As we have mentioned, the foreign-born population also includes naturalized American citizens.
A second issue with the federal prison system’s data is that they are not representative of the overall criminal justice system. The federal system is mainly comprised of those who have committed drug crimes, weapons- and explosives-related crimes, white collar crimes/fraud, or immigration crimes. In contrast, state prisons, which account for the vast majority of those in prison, house people convicted primarily of violent crimes and other serious offenses. Some have suggested that a third issue with federal prison data is that about 11.1 percent of the federal prison system is comprised of persons serving time on immigration crimes. But even if we exclude those incarcerated for immigration crimes, non-citizens still have high rates of incarceration. Federal prison data from 2009 indicate that non-citizens accounted for about 18 percent of those in the federal prison system for crimes other than those related to immigration. This implies a high rate of incarceration for non-citizens in federal prisons since non-citizens are 7.1 percent of the total population and 8.4 percent of the adult population.53 But it is not as high as the 26.4 percent when immigration offenses are included. It is also worth pointing out that the immigration crimes that result in federal sentences are not minor; they include crimes such as large-scale fraud, smuggling, or illegal re-entry after deportation, not civil offenses like visa overstay or employment.
Overview of SCAAP Program. Another source of data on immigrant incarceration is the State Criminal Alien Assistance Program (SCAAP). It was created to help states and local governments pay for the incarceration of illegal aliens. States and local governments can receive money from the federal government for “undocumented criminal aliens” with at least one felony or two misdemeanor convictions under state or local law. The illegal alien must have been housed for four or more consecutive days in a correctional institution. Grants are awarded based on a formula and funding is limited. Once an inmate is convicted, the state can apply for money to cover the costs of incarceration both pre- and post-conviction. States and localities are compensated for inmate days incarcerated. So, for example, if illegal aliens accounted for 5 percent of all the hours that all inmates spent incarcerated in a jurisdiction, then the jurisdiction could ask the federal government for an amount of money equal to 5 percent of their expenditures. It is possible that illegal immigrants are a smaller or larger fraction of inmate hours than they are of actual inmates. But since length of time in prison generally reflects the seriousness of the crime, the SCAAP data should provide a reasonable picture of what share of inmates are illegal aliens.
From a research perspective, the potential value of SCAAP data is that they should offer insight into the incarceration of illegal aliens. Unlike Census Bureau or other survey data, ICE attempts to verify that those names submitted by the local jurisdiction are, in fact, illegal aliens. Jurisdictions applying for money must report how many hours all inmates (illegal aliens and non-illegal aliens) have been incarcerated during the year, and what share of those hours were the result of incarcerated illegal aliens. This means we have a numerator and denominator, making it possible to calculate what share of an incarcerated population is comprised of illegal aliens. Of course, the accuracy of such a calculation depends on both the accuracy and availability of the data.
SCAAP Data for 2005. Table 5 shows data from the 2005 SCAAP awards. This is the most recent year for which detailed information has been made public. The 2005 awards were for illegal aliens incarcerated between July 1, 2003, and June 1, 2004.54 The table reports the share of the state prison system (inmate hours) that was comprised of illegal immigrants in the six states with the largest illegal immigrant populations. These states accounted for 62 percent of the total illegal alien population in 2005 according to DHS. Many other states and hundreds of localities also participate in the SCAAP program to varying degrees and it should be possible to do the same calculation for other places. But the six states we chose have the most robust estimates for the illegal population from DHS, making them the best jurisdictions to compare with SCAAP data.

Table 5 reports the two groups of individuals for whom jurisdictions receive compensation from the federal government — those who are confirmed as illegal aliens and those whose status is “unknown.” ICE runs the information on inmates through several immigration databases to try to determine an inmate’s immigration status. Inmates are classified as Eligible, Unknown, Ineligible, or Invalid. In addition to those definitively identified as illegal aliens (eligible), inmates classified as “unknown” are those whose immigration status could not be definitively determined through the databases. These are typically illegal aliens with no prior contact with immigration authorities. That is, they have never been inspected at a port of entry, apprehended, placed in removal proceedings, or applied for an immigration benefit. It is possible some of these individuals are native-born Americans. But this is unlikely; jurisdictions submit a name to SCAAP because the correctional institution has reason to believe the person was foreign-born and in the country illegally. Moreover, the inmate must have been unable to provide any documentation or record indicating U.S. citizenship, including a prior criminal history.
Jurisdictions can be sanctioned if they are caught frivolously submitting names in order to receive partial reimbursement. Inmates in the unknown category should never be green card holders (legal permanent residents), temporary visa holders who overstay their time limit, or naturalized American citizens because the databases would identify such individuals given their prior contact with the immigration system. Because of the very high probability that they are illegal aliens, the federal government provides compensation to prisons and jails for “unknown” status individuals equal to 60 and 80 percent (respectively) of the costs they create.
SCAAP Data for the Top Illegal States. The first and second columns of Table 5 show the total incarcerated days for prisoners in the state prison population, and days served by illegal aliens. The third column shows the share of prison days attributable to illegal aliens. The fourth and fifth columns show days served by likely illegal aliens (the “unknown”) and their share of the total. The sixth column adds the illegal alien share to that of likely illegal aliens. The table shows there is a good deal of variation in the share of prison inmates who are illegal immigrants in these top states of illegal immigrant settlement. In Arizona and California, illegal immigrants account for about one out of nine and one out of eight inmate hours respectively. In the other states the illegal share is much smaller. In interpreting Table 5, it is helpful to remember that, according to the federal government, the Center for Immigration Studies, and the Pew Hispanic Center, about 4 percent of the U.S. population is comprised of illegal immigrants. While illegal immigrants are not evenly distributed across the country, this low share of the overall population is important to consider when thinking about their possible share of the incarcerated population.
Putting aside the question of whether illegal aliens commit a disproportionate share of crime, most Americans probably feel that if one out of eight serious criminals (those in prison) in their state are not even supposed to be in the country, then this is a serious problem. Whether they are a disproportionate share of prisoners, relative to their share of the total population, may matter little to the general public, but it is certainly reasonable to argue that the SCAAP data, like the 287(g) data, show that at least in some parts of the country illegal alien crime is not trivial. This fact has both practical and political implications that simply cannot be dismissed as an irrational fear of immigrants.
Placing SCAAP Data into Context. Table 5 reports the percentage of illegal aliens in state prisons (measured in inmate hours). Table 6 attempts to place the results from SCAAP into demographic context. The first column in Table 6 is from Table 5, showing illegal aliens’ share of state prisoners. The second column shows the estimated share of the states’ total population comprised of illegal aliens based on DHS estimates.55 Illegal aliens comprise a larger share of the adult population than they do the overall population. This is because, like legal immigrants, illegal immigrants generally come as adults and most of the children in illegal immigrant families are U.S.-born and are therefore not illegal aliens. In column three we estimate the illegal share of the adult population. Overall the table indicates that in California, Arizona, and New York illegal aliens comprise a larger share of the state prison population than they do of the total population and the adult population. In New York State in particular, the illegals’ share of the state prison system is well out of proportion to their share of the adult population — more than double. However, in Illinois, Texas, and Florida their share of the adult population and the prison population is very similar.
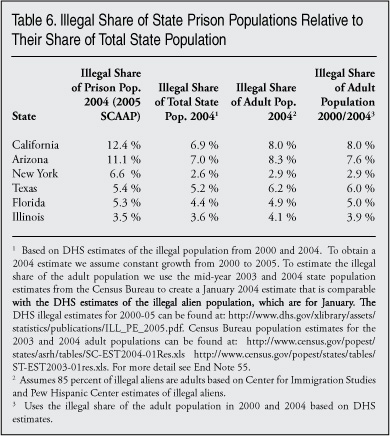
It is possible to adjust the data in other ways as well. One of the biggest issues is the demographic lag for the prison system. As pointed out earlier, immigrants (legal or illegal) were a smaller fraction of the U.S. and state populations in earlier years. And as already discussed, about one-third of those in state prisons nationally have been there five or more years and 15 percent have been there for more than 10 years. This matters because in many states illegal aliens were a much smaller fraction of the total population 10 years ago than they are now. According to the federal government, for example, in Texas illegal aliens were 2.3 percent of the total population in 1990, in 2000 they were 4.7 percent of the state’s total population, and in 2004 they were 5.3 percent of the state’s population. In Arizona, illegal aliens were 2.2 percent of the total population in 1990, in 2000 they were 5.2 percent, and in 2004 they were 7.2 percent.56
Unfortunately no year-to-year data exist on the size of the illegal population by state. However, the fourth column in Table 6 shows the share of the state adult populations that are illegal, averaging their share of the adult population in 2000 and 2004. Over all, Table 6 shows that illegal aliens are a larger share of the prison population in some states than they are of the overall state adult population, but not in other states. In general, it makes relatively little difference. But it does mean that in Arizona, for example, the illegal share of the state prison population is quite high relative to their share of the adult population for the four years prior to 2004, the year for which we have complete SCAAP data. If the data were adjusted for, say, the illegal population in 1995, the difference between the illegal share of the prison population and their share of the adult population would be even larger.
Problems with SCAAP Data. It is important to note the limitations of the above analysis. First, we only examine the six states with the most robust estimates for their illegal populations. But how accurate are DHS estimates of the illegal population in these states? Second, all 50 states and hundreds of local jurisdictions participate in SCAAP. Careful analysis of these other localities may show a different pattern. A third issue with SCAAP data is that there is no good way to measure how many illegal aliens in jail are missed by the program. While inmates for whom the government provides reimbursement are almost certainly illegal aliens, this does not mean there are no other incarcerated illegal aliens in these states.
The primary means states use to identify likely illegal immigrants is to ask them if they are foreign-born. Once an inmate has been identified as such, the prison or jail attempts to determine if the inmate might qualify for SCAAP and then submits the inmate’s name to ICE. What is not clear is what happens if an illegal alien simply says he or she is a U.S. citizen or legal resident. How much follow-up and verification occurs when there is a claim of U.S. citizenship is unknown. Based on our interviews with law enforcement and ICE personnel familiar with the programs, it seems clear that the way persons are identified as qualifying for SCAAP varies significantly between jurisdictions. Not surprisingly, opinions on the accuracy of data from SCAAP vary widely among immigration and law enforcement personnel.
To accurately assess the SCAAP program we would need to know the actual number of incarcerated illegal aliens in a jurisdiction and compare it to the results from SCAAP. The 287(g) program discussed earlier in this report may provide a way to test SCAAP data in a limited way. Table 7 compares data from the 2005 SCAAP awards (figures are for 2004) with data from the 287(g) information for the five jurisdictions reported in Table 3 for which we had illegal alien data. The number of illegal aliens in a jail may change over time, but it seems unlikely that it would fluctuate dramatically between 2004, the year for which we have SCAAP data, and 2007, the year of the 287(g) data. Table 7 shows that the figures from the 287(g) program do not come close to those from the SCAAP program.
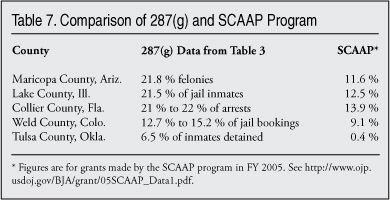
It should be noted that the figures we were able to obtain for Maricopa County were for felons, not for all those incarcerated. It is possible illegal immigrants are much more likely to commit felonies in that county than they are to commit other crimes that land them in jail and qualify for funding under SCAAP. Lake County would seem to offer the best point of comparison because the figures are for jail inmates, which should correspond pretty closely to the inmate hours that Lake County was compensated for under SCAAP. The Collier County 287(g) data are for arrests, while the data for Weld County are for jail bookings. Not all people arrested or booked end up in jail for four days or more. So these two counties represent a more imperfect comparison with SCAAP.
Overall, Table 7 appears to show that SCAAP is significantly under-estimating the number of incarcerated illegal aliens. If this is correct, one possible reason is the problem of truthful self-reporting. However, our conclusion that SCAAP underreports illegal aliens is tenuous. There are only five jurisdictions in the table out of the hundreds that participate in the SCAAP program. Moreover, the 287(g) information we have does not, in most cases, exactly match the year and the type of data SCAAP provides. The SCAAP information is measured in inmate hours, not individual inmates. What we can say is that there is some indication that SCAAP significantly understates the number of incarcerated illegal immigrants.
Removal of Criminal Aliens. Each year immigration authorities remove from the United States individuals termed “criminal aliens.” These are aliens who were removed on the basis of a criminal charge or who have a criminal conviction. Between 1998 and 2007, about 816,000 aliens were removed because of criminal behavior.57 These figures do not include individuals whose only offense was living or working in the United States illegally. But it does include those aliens involved in criminal immigration offenses, which will be discussed below. The overall number of criminal aliens removed is certainly significant, and makes clear that crime by non-citizens is certainly not trivial. But by themselves, these numbers do not indicate whether immigrants or non-citizens have high or low crime rates.
Most criminal aliens are identified while serving their time in prison or jail. Those criminal aliens who get removed by the government represent some unknown share of the total number of immigrants who have committed and/or have been imprisoned for crimes. Only those criminal aliens who actually come to the attention of immigration authorities are removed and typically only after they have served their sentences. Moreover, immigration authorities do not have the enforcement resources to remove all those who qualify, even if someone is identified as a criminal alien. Unfortunately, data on what crimes these individuals have committed are somewhat limited. However, detailed information is available for 2007. Figure 3 reports the crimes for which criminal aliens were deported. Of the 99,924 criminal aliens removed in that year, 21.6 percent were removed for immigration crimes such as alien smuggling, human trafficking, re-entry after deportation, or immigration fraud. The largest single group of crimes were drug related, accounting for 33.5 percent of all removals. After drug and immigration crimes, other major categories for which criminal aliens were removed in 2007 were assault, burglary, larceny, sexual assault, robbery, family offenses, sex offenses, and stolen vehicles.58
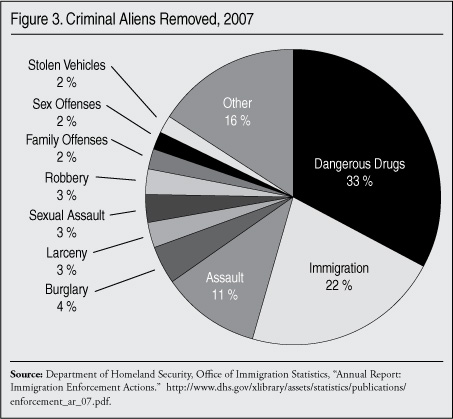
As already mentioned, the fact that large numbers of criminal aliens are removed from the United States may also push down the overall incarceration rates of immigrants. Recidivism among criminals is common — Justice Department statistics indicate that about two-thirds of criminals are re-arrested within three years of release.59 The same is true of criminal aliens. A Department of Justice study found that 73 percent of criminal aliens who were released rather than removed were arrested at least once more. The average number of additional arrests for each individual was six.60 Since native-born Americans are never removed by the government, this difference with immigrants who commit crimes could have a significant impact on incarceration rates.
It is worth noting that criminal aliens who are removed can and do sometimes return to the United States illegally. We were unable to locate any statistical information on how often this occurs. We do know from studies of U.S. District Court statistics61 that more than 1,000 people per month are charged for re-entry after deportation, a federal felony, and that the majority of these individuals have serious criminal histories.
Conclusion
This report demonstrates the difficultly in trying to come to any conclusion about the extent of immigrant criminality. Problems with data collection and contrary results characterize information about the link between immigrants and crime. A new estimate from ICE’s Secure Communities Initiative and data from the 287(g) program tend to show high rates of immigrant crime. This directly contradicts earlier academic research based on census data and other demographic and generic crime reporting data. A comparison of the 2000 census and government estimates shows how difficult it is to draw conclusions about immigrant criminality. Results from the 2000 census imply that only about 4 percent of prisoners in jails and prisons are immigrants (legal and illegal), but the new ICE estimates show it is 20 percent. What’s more, an audit by an outside firm of eight million inmate records paid for by ICE found that about 22 percent of inmates are immigrants. But questions remain regarding all of these numbers.
As we have shown in this report, the Census Bureau was unable to collect good immigrant data for prisoners in 1990 and 2000 and was forced to guess their citizenship more than half the time in 2000. Thus two recent studies looking at this data are essentially measuring the Bureau’s guesses, not actual immigrant incarceration. As for the Secure Communities Initiative estimate, ICE has not published a detailed methodology statement on the estimates, and what information is available is difficult to interpret. Even data that should be somewhat comparable produces very dissimilar results. For example, the SCAAP program reimburses jails for the costs of incarcerating illegal immigrants, and the 287(g) program and related efforts identify incarcerated illegal aliens by having trained officers investigate the immigration status of prisoners. But the two programs show very different levels of illegal alien incarceration in the same jails.
Some opinion surveys show that the public thinks immigrants overall or illegal aliens in particular have high rates of crime. On the other hand, a number of academic researchers and journalists have argued that immigrants have low rates of crime. In our view, poor data quality and conflicting evidence mean that neither of these views is well supported. Given the limitations of the data available, it is simply not possible to draw a clear conclusion about immigrants and crime. If the 287(g) program is widely and consistently applied, it offers the best hope for getting a better handle on this question, at least with regard to non-citizens. Because trained officers actually investigate the immigration status of prisoners and inmates, the data are almost certainly of the highest quality. While at present the program has found high rates of illegal alien incarceration in some county jails, only a tiny number of communities are part of the program. Even if more jails were part of the program, it would have to be applied in a systematic way to all persons arrested or jailed to be useful to researchers.
Further implementation of the Secure Communities inter-operability initiative might produce more data to shed light on the question, as the initiative will provide screening in places not previously covered well by ICE. However, the program is automated and identifies only those with a previous immigration history — that is, some previous contact, lawful or unlawful, with U.S. immigration authorities. The best way to gather complete data is for correctional institutions to screen all inmates using ICE databases. As more communities and state prisons move toward more comprehensive screening for immigration status a clearer picture of illegal alien criminality may emerge.
In conclusion, we find that it would be a mistake to assume that immigrants as a group are more prone to crime than other groups, or that they should be viewed with more suspicion than others. Even though immigrant incarceration rates are high in some populations, there is no clear evidence that immigrants commit crimes at higher or lower rates than others. Nevertheless, it also would be a mistake to conclude that immigrant crime is insignificant or that offenders’ immigration status is irrelevant in local policing. The newer information available as a result of better screening of the incarcerated population suggests that, in many parts of the country, immigrants are responsible for a significant share of crime. This indicates that there are legitimate public safety reasons for local law enforcement agencies to determine the immigration status of offenders and to work with federal immigration authorities.
End Notes
1 This includes naturalized American citizens, legal permanent residents (green card holders), illegal aliens, and people on long-term temporary visas such as students or guest workers who respond to the CPS. It does not include those born abroad of American parents or those born in outlying territories of the United States such as Puerto Rico. There are five possible responses to the citizenship question: 1) Born in U.S.; 2) Born in an outlying territory of the U.S., such as Puerto Rico; 3) Born aboard of American citizen parents; 4) Naturalized U.S. citizen; 5) Not a citizen. The first three responses are considered native-born, the last two are considered foreign born.
2 All figures for population come from the 2007 public-use file of the American Community Survey.
3 The 2007 American Community Survey shows that immigrants were 12.6 percent of the nation’s total population, but they were 15.7 percent of those who were of working age (16 to 64).
4 Finding detailed information on length of stay for inmates at any one time is very difficult. Tom Bonczar of the Bureau of Justice Statistics provided the Center for Immigration Studies with the following information in an email dated December 17, 2008: “Of an estimated 1,226,671 state prison inmates included in the survey, an estimated 8.3 percent had served less than six months, 11.5 percent had served six to 11 months, 47.9 percent had served 12 to 59 months, and 32.3 percent had served 60 months or more.” These figures are from 2004 and are derived from the “Survey of Inmates in State and Federal Correctional Facilities.” The public-use data from this same file do not produce exactly the same results, but they are very close. Using the public-use file of the survey we found that 15 percent of immigrants have been incarcerated for more than 10 years.
5 These data come for the March 1995 and March 2007 Current Population Surveys.
6 While there are a number of reasons to think this may be the case, research on this questions is somewhat conflicted. Stephen M. Schnebly has found that as the immigrant concentration of an area increases, victims of crime are less likely to report their victimization. (“The Influence of Community-Oriented Policing on Crime Reporting Behavior,” Justice Quarterly, 25(2), 2008, pp. 223-251.) Elijah Anderson argues that in some low-income areas youths and immigrants are reluctant to go to the police (Elijah Anderson, Code of the Street: Decency, Violence, and the Moral Life of the Inner City, New York: W.W. Norton, 1999). Robert Davis and Nicole Henderson argue that although there are reasons to think immigrants will report less crime, they do not find this is the case (“Willingness to Report Crimes: The Role of Ethnic Group Membership and Community Efficacy,” Crime & Delinquency, 49(4), pp. 564-580, 2003.). The National Crime Victimization Survey finds conflicting evidence on this account. Immigrants are not specifically identified in the survey. The most recent data available are for 2006 and show a larger share of Hispanic victims than non-Hispanic victims did not report their victimization (41.6 percent vs. 50.3 percent). This could be evidence that crimes against immigrants go unreported at a much higher rate than for natives. But prior years of the survey show no clear or consistent pattern on this account. In some years Hispanics are much more likely to report their victimization and in some years they are less likely to report a crime. Other research has shown that only certain crimes, such as domestic violence, are under-reported by immigrants, due to different cultural perceptions of the crime.
7 There is a relatively large body of literature showing that serious crime is generally intra-racial and ethnic. As William Wilbanks pointed a number of years ago, “One of the most commonly accepted facts of criminology is that violent crime, with the possible exception of robbery, is intraracial.” (William Wilbanks, “Is Violent Crime Intraracial?” Crime & Delinquency, 31(1), pp. 117-128, 1985). The Crime Victimization Survey also has shown that over the years two-thirds to three-fourths of crime victims report that the perpetrator was of their own race. The FBI statistics for murder show the same basic pattern. FBI data on murder can be found at www.fbi.gov/ucr/cius2007/offenses/expanded_information/data/shrtable_05..... However, there is very little data on immigrants specifically so while it is seems likely that the primary victims of immigrants’ crimes will at least be co-ethnics, this is not a certainty.
8 For the years 1997 to 2006 we use the Yearbook of Immigration Statistics, Table 43, to determine the number of criminal aliens deported/removed. A March 2008 press release from ICE reported 95,000 deportations and removals of criminal aliens in 2007. See http://www.ice.gov/pi/news/factsheets/secure_communities.htm. It is important to note that these figures do not include a large number of immigrants who committed serious crimes, but who were removed on administrative immigration and criminal charges due to a lack of resources. They also do not include individuals whose only offense was being or working in the United States illegally. Most of the criminal aliens forced to leave the country are individuals who have served their time in state or federal prison or a local jail, or are individuals who have reentered illegally after previously having been formally deported. In 2006, the Office of Immigration Statistics reported that 76 percent of criminal aliens were deported/removed for a crime not related to immigration law, the largest share for drug offenses. Figures can be found in Table 4, “Immigration Enforcement Actions: 2006” at www.dhs.gov/xlibrary/assets/statistics/publications/enforcement_ar_06.pdf.
9 “Crime, Corrections, and California: What Does Immigration Have to Do with It”? by Kristin F. Butcher and Anne Morrison Piehl can be found at http://www.ppic.org/main/publication.asp?i=776.
10 “The Myth of Immigrant Criminality and the Paradox of Assimilation: Incarceration Rates among Native and Foreign-Born Men,” authored by Ruben G. Rumbaut and Walter A. Ewing, can be found at www.immigrationpolicy.org/index.php?content=sr20070221.
11 The 2000 census was the last to have a long form. The yearly American Community Survey is replacing the long form.
12 The 2000 Census: Counting Under Adversity, Constance F. Citro, Daniel L. Cork, and Janet L. Norwood, eds., Panel to Review the 2000 Census, National Research Council.
13 See p. 298, Table 7.9, of The 2000 Census: Counting Under Adversity.
14 See p. 298, Table 7.9, of The 2000 Census: Counting Under Adversity.
15 See Table 6.1b, page 27, of Census 2000 Evaluation E.5, Revision 1 Group Quarters Enumeration FINAL REPORT, August 6, 2003, Kimball Jonas Decennial Statistical Studies Division, at www.census.gov/pred/www/rpts/E.5 percent20R.pdf.
16 Census Bureau staff report that the citizenship question was allocated for those in institutions only about 6 percent of the time. It seems this definition of allocation includes hot and cold decking procedures, but not logical edits. While greater analysis would need to be done to confirm the exact meaning of this reported allocation rate, it does seem clear that ACS provides much better long-form data than the 2000 or 1990 censuses.
17 The figures for ICE detention for 2000 can be found at www.ojp.usdoj.gov/bjs/pub/pdf/p06.pdf. Figures for 2007 can be found at www.ojp.usdoj.gov/bjs/pub/pdf/p07.pdf (p. 26, Table 18). The figures include all those held by ICE, even those held at facilities not run by ICE.
18 If we compare the number of male immigrants in Table 2 in California the growth is even smaller from 2000 to 2007, just 1.9 percent.
19 For country of birth, the public-use file shows an allocation rate of 51.8 percent This is very close to the 54 percent found in Table 7.9 of the NRC study for prisoners. The only reason for the differences is that the NRC study was based on the internal data file of the Census Bureau, not the public-use file and the 54 percent was just for prisoners while the 51.8 percent is for all persons in institutions.
20 It is interesting to note that in the 2000 census public-use file more than half of the responses to the country of birth question are shown as imputed. Again, this is because it was the triggering variable to the hot decking procedure and thus was considered to be “imputed.” Had the authors of the two studies looked at imputation for the country of birth question, which they used in their respective studies, they might have noticed something was amiss. But since their primary variable of interest was citizenship, which falsely showed low rates of imputation, it is not surprising that the huge problems with the country of birth question went unnoticed. ACS staff have indicated that it no longer reports allocations in this way. As the ACS moves forward, the hope is that it will become a good source of data for those in institutions. Time and careful analysis will determine if this is in fact the case.
21 For a summary of some of this older literature, see Joan McCord’s article “Ethnicity, Acculturation, and Opportunities: A Study of Two Generations,” in Ethnicity, Race, and Crime, D.F. Hawkins, ed., Albany: State University of New York Press, 1995. See also Ramiro Martinez, Jr., and Matthew T. Lee, in On Immigration and Crime, National Institute of Justice, Criminal Justice 2000: The Nature of Crime Vol 1, at http://www.ncjrs.gov/criminal_justice2000/vol_1/02j.pdf.
22 IPC study, p. 14. In the same report the authors report national trends. Crime rates generally peaked in the United States around 1994, and it was in this same year that the Census Bureau began to include a question on citizenship, which identifies the foreign-born.
23 A. Blumstein and J. Wallman summarize many of the reasons for the drop in crime in “The Crime Drop and Beyond,” Annual Review of Law and Social Science, vol. 2, pp. 125-146, 2006. Steven Levitt argues that just four factors account for virtually all of the drop in crime: increase in number of police, rising prison populations, a waning crack epidemic, and the legalization of abortion that reduced the crime-prone population. See “Understanding Why Crime Fell in the 1990s: Four Factors that Explain the Decline and Six that Do Not,” Journal of Economic Perspective, Winter 2004, pp. 163-190. Other researchers, such as Fox and Piquero, tend to emphasize one main factor causing the decrease. See James Alan Fox and Alex R. Piquero, “Deadly Demographics: Population Characteristics and Forecasting Homicide Trends,” Crime & Delinquency, vol. 49, no. 3, pp. 339-359, 2003.)
24 Kristin F. Butcher and Anne Morrison Piehl, “Why are Immigrants’ Incarceration Rates so Low? Evidence on Selective Immigration, Deterrence, and Deportation,” NBER Working Paper No. 13229, July 2007, at http://papers.nber.org/papers/w13229. The study was based on an earlier paper published by the Federal Reserve Bank of Chicago, which can be found at www.chicagofed.org/publications/workingpapers/wp2005_19.pdf.
25 The institutional data from the 1980 census has not been studied in the way that the data from 2000 and 1990 have. Given very the large and clear problems with the institutionalized data from 1990 and 2000 censuses, results from the 1980 census should be interpreted with great caution. Moreover, the 1980 data are now 29 years old. The size of the immigrant population and its socio-demographic characteristics have changed significantly in the last three decades.
26 Kristin Butcher and Anne Morrison Piehl, “Cross-City Evidence on the Relationship between Immigration Crime,” Journal of Policy Analysis and Management, vol. 51, no. 4, July 1998.
27 U.S. Commission on Immigration Reform, Restoring Credibility, Washington, DC: U.S. Commission on Immigration Reform, 1994.
28 John Hagan and Alberto Palloni, “Immigration and Crime in the United States,” in The immigration Debate, J.P. Smith and B. Edmonston, eds. Washington, DC: National Academy Press, 1998.
29 Pedro H. Albuquerque ,“Shared Legacies, Disparate Outcomes: Why American South Border Cities Turned the Tables on Crime and Their Mexican Sisters Did Not,” Crime, Law and Social Change, vol. 47, no. 2, pp. 69-88, 2007.
30 James Lee, “Characteristics of Major Metropolitan Destinations of Immigrants,” Department of Homeland Security, Office of Immigration Statistics, February 2009, http://www.dhs.gov/xlibrary/assets/statistics/publications/metro_fs_2006....
31 This is based on the March 2007 Current Population Survey.
32 The argument that immigration may reduce the net in-migration of less-educated natives is most associated with the work of William Frey. See William H. Frey, “Immigration and Internal Migration ‘Flight’ from U.S. Metropolitan Areas: Toward a New Demographic Balkanisation,” Urban Studies, 32 (4-5), pp. 733-757, 1995; and William H. Frey, Immigration and Domestic Migration in U.S. Metro Areas: 2000 and 1990 Census Findings by Education and Race, Research Report 05-572, Population Studies Center, 2005.
33 See Table 92 in Criminal Victimization in the United States, 2006 Statistical Tables, at: www.ojp.usdoj.gov/bjs/pub/pdf/cvus06.pdf.
34 See Note 5.
35 The FBI’s list of most-wanted murderers, which changes from month to month, can be found at http://www.fbi.gov/wanted/fugitives/vc/murders/vc_murders.htm.
36 See “The Illegal-Alien Crime Wave” City Journal, Winter 2004, at http://www.city-journal.org/html/14_1_the_illegal_alien.html.
37 See Jessica Vaughan and Jon Feere, “Taking Back the Streets: ICE and Local Law Enforcement Target Immigrant Gangs,” at http://www.cis.org/immigrantgang.
38 Mark Hugo Lopez, et al, “A Rising Share: Hispanics and Federal Crime,” Pew Hispanic Center, February 2009, http://pewhispanic.org/reports/report.php?ReportID=104.
39 Jessica M. Vaughan and James R. Edwards, “The 287(g) Program: Protecting Home Towns and Homeland,” Center for Immigration Studies, October 2009, http://cis.org/287greport.
40 Maricopa County, Ariz.: The Maricopa County Attorney’s Office report entitled “Illegal Immigration,” can be found at www.mcaodocuments.com/press/20081002_a-whitepaper.pdf. The 21.8 percent is for defendants sentenced for felonies in Maricopa County Superior Court.
Collier County, Fla.: Former Sheriff Don Hunter reported that self-admitted illegal aliens comprised 22 percent of those booked into Collier County jail from August 1 to 31, 2007. He also reported that on September 14, 2007, there were 245 self-admitted illegal alien inmates, accounting for 20 percent of all inmates. Sheriff Hunter’s report, “Illegal Immigration and Law Enforcement: Implications for Domestic Security and Local Jurisdictions,” can be found at www.colliersheriff.org/Index.aspx?page=2137.
Lake County, Ill.: At a press conference on September 18, 2008, Lake County Sheriff Mark Curran reported that, with the assistance of ICE, the county had conducted an audit of its jail population in August. They determined that 137 of 637 inmates were foreign-born (21.5 percent). Of those, 122 were illegal aliens (19 percent) or of “questionable” immigration status. They also determined that half of all the incarcerated murderers were illegal aliens (seven out of 14). See also www.chicagotribune.com/news/local/chi-curran-illegals-19-sep19,0,707324.....
Weld County, Colo.: In a forum on illegal immigration held in November 2007, the District Attorney and Sheriff in Weld Country reported that in September 2007 12.8 percent of people booked in the county jail were illegal aliens and in October of the same year, 15.2 percent were illegal aliens. While the county does not have 287(g) authority, they do work closely with ICE. See “Officials criticize report on ICE raids,” Rocky Mountain News, November 2, 2007, at http://m.rockymountainnews.com/news/2007/Nov/02/officials-criticize-repo....
Tulsa County, Okla.: According to statistics provided to Jessica Vaughan of the Center for Immigration Studies, from January to August 2008 1,335 out of 20,443 total inmates detained in the county jail were illegal aliens (6.5 percent). Wayne Kirkpatrick of the Tulsa County Sheriffs Office provided the information to CIS on September 16, 2008.
Prince William County, Va.: This suburban Washington, DC, county has been one of the most studied localities using 287(g) in the country. A great deal of excellent data is found in the report done by the University of Virginia Center for Survey Research (CSR). The CSR reports that 3 percent of those arrested in the county in 2008 for serious crimes were illegal aliens and 6 percent of those arrested for less serious crimes were illegal aliens. See Tables 6-1 and 6-2 in the CSR report, at http://cooperdev.museinmotion.com/sites/cis.org/files/publications/PWC20... percent20Report percent20with percent20Cover.pdf.
Gwinnett County, Ga.: As pat of its effort to be included in the 287(g) program, the county Sheriff’s office reported in a PowerPoint presentation dated June 27, 2008, that 30.8 percent of jail admissions for 2007 were foreign-born. The projected total jail admissions for 2008 were 39,484, with a projected foreign-born population of 13,081 (33 percent). The presentation can be found at www.gwinnettcountysheriff.com/Foreign_National_287_G_June_27_update.ppt.
Alamance County, N.C.: In a document prepared for the Wake County, N.C., Board of Commissioners, Alamance County, which is enrolled in the 287(g) program, reported that 30 percent of inmates processed in the county jail are foreign-born. See www.wakegov.com/agendas/2007/november5/07/cover.htm.
Wake County, N.C.: In a document prepared for the Wake County Board of Commissioners, the Wake County Sheriff reported that 17 percent of jail inmates were foreign-born. See www.wakegov.com/agendas/2007/november5/07/cover.htm.
Mecklenburg County, N.C.: In a document prepared for the Wake County, N.C., Board of Commissioners, Mecklenburg County, which is enrolled in the 287(g) program, reported that 11 percent of inmates processed in the county jail are foreign-born. See www.wakegov.com/agendas/2007/november5/07/cover.htm.
41 We use the combined 2005-2007 data from the American Community Survey for the total foreign-born. The combined three-year sample from the ACS for these counties, all of which have large populations and resulting large samples, should provide the most robust estimates of the foreign-born available at the local level. The three-year sample is ideal because estimates from a single year would be much smaller using the ACS. DHS estimates for the illegal population are based on ACS data from 2006, which is the middle year of the combined 2005-07 estimates. Data from the 2007 ACS are also available for the total foreign-born. The results for the overall foreign-born in 2007 in these counties is very similar to the figures from the combined three-year ACS sample. The 2007 ACS data show the following: Maricopa County, Ariz., 18.0 percent foreign-born; Collier County, Fla., 24.6 percent; Lake County, Ill., 17.6 percent; Weld County, Colo., 9.6 percent; Tulsa County, Okla., 7.4 percent; Gwinnett County, Ga., 22.6 percent; Alamance County, N.C., 7.9 percent; Mecklenburg County, N.C., 12.3 percent; Wake County, N.C., 11.7 percent.
42 Estimates for the illegal alien share of local population are based on the assumption that they are the same share of the local foreign-born population as they are of the state’s foreign-born population. DHS used the 2006 American Community Survey (ACS) to create its estimates of illegal aliens. DHS adjusts its 2006 ACS-based estimates upward by 10 percent because of those missed by the survey. To see how the DHS adjusts its estimates for undercount, see Table 2 in their 2007 estimates, at www.dhs.gov/xlibrary/assets/statistics/publications/ois_ill_pe_2007.pdf. Adjustment “f” in Table 2 of the DHS estimates shows the 10 percent upward adjustment. Also see the discussion on pages 4 and 5 of the 2005 DHS illegal estimates. The share of the states’ foreign-born population that is illegal can be calculated by taking the DHS state illegal estimates and adjusting them downward by 10 percent and then dividing by the total foreign-born from the 2006 ACS. So, for example, in Arizona DHS estimates indicate that in 2006 52 percent of the foreign-born were illegal aliens. We make the same assumption for Maricopa County with the results that 8.9 percent of the county’s population is made up of illegal immigrants. Because DHS does not have an estimate for illegal immigrants in Colorado, we used the Center for Immigration Studies estimate for the share of Colorado’s foreign-born population that is comprised of illegal aliens. See Table 21 in Immigration in the United States 2007: A Profile of the Foreign-Born Population, at www.cis.org/immigrants_profile_2007. No estimate of Oklahoma’s illegal population exists. However, in the table we assume that half of the county’s foreign-born population is comprised of illegal aliens. This would be a very large share, almost matching Arizona, the state where illegals comprise the largest share of the foreign-born of any state for which there exists an illegal estimate.
43 The adult share of the local population is based on the assumption that illegal immigrants are the same share of the adult population at the state level as they are the local level. Research by the Center for Immigration Studies and Pew Hispanic Center indicates that 85 percent of illegals are adults. So for example, the calculation for Maricopa county is as follows: In Arizona illegal aliens are 7.7 percent of the state population and 8.9 of the state’s adult population, a ratio of 1.152 to 1. To get the illegal share of the adult population in Maricopa county we multiply their 8.9 percent share of the county’s total population by 1.152 and get 10.3 percent. For the bottom portion of the table we simply calculate the foreign-born as a share of the state adult population relative to the adult population using the public 2005-2007 ACS files. We then assume that this ratio is the same at the local level as well as the state level. So, for example, the 2005-2007 ACS shows that the foreign-born in Georgia are 9.1 percent of the total state population and 11.14 percent of the adult population — a ratio of 1 to 1.224. Since the foreign born are 22.9 percent of Gwinnett County’s total population, they should be 28 percent of the county’s adult population (22.9 percent * 1.224).
44 Correctional institutions that are part of 287(g) or have worked with ICE use a number of checks that should identify those who are foreign-born or illegally in the country. One possible way of missing someone is if they sneaked into the country and never had any contact with immigration authorizes or local law enforcement prior to ending up in jail. If such as persons then claimed U.S. citizenship in a fashion believable to the correction institution, they could be missed by the system.
45 See the Secure Communities Initiative Fact Sheet, at http://www.ice.gov/pi/news/factsheets/secure_communities.htm.
46 These percentages for the overall population come from the 2005-2007 American Community Survey (ACS) public use files. Throughout most of this report we use the 2007 single ACS to provide the immigrant (citizen or non-citizen) share of the U.S. population. In the above analysis we use the combined three-year sample because the footnote from ICE in Table 4 says that the data to estimate the incarcerated immigrant population came from 2005 through 2007.
47 As a result of a Freedom of Information Act request made earlier this year, we were able to obtain from the ICE Public Affairs Office a spreadsheet showing what appears to be the number of removable aliens identified by local ICE Offices from 2005 to 2007. But we have not received any methods statement or any information describing the relationship between this spreadsheet and the information ICE provided in Table 4. Thus at present how ICE estimates that 20 percent of the prison and jail population is foreign-born remains unknown.
48 U.S. Immigration and Customs Enforcement, “Institutional Removal Program National Workload Study,” prepared by Fentress, Inc., September 2004. We obtained a copy of the report through a Freedom of Information Act request. It is available at www.cis.org/sites/cis.org/files/articles/2009/fentress-report.pdf.
49 The 14.7 figure is from the 2004 American Community Survey. The 15.4 percent figure reported earlier in this report is the adult foreign-born share in 2007.
50 The fact that state prisons from a number of top immigrant-receiving states were left out of the analysis could skew the number of immigrant inmates downward. On the other hand, the jails were selected based both on size and large immigrant populations, which should skew the immigrant share upward.
51 The latest statistics for those in federal prison can be found at the Federal Bureau of Prisons (BOP) web site, at www.bop.gov/news/quick.jsp#1. The figures at the BOP site indicate that 73.7 percent of inmates are U.S. citizens. The Bureau identifies 17.4 percent of the population as having Mexican citizenship, with 5.2 percent classified as other countries or unknown.
52 Figures are from the public-use file of the March 2009 Current Population Survey. The 2009 American Community Survey will not be available until 2010.
53 In 2009 (July 25) there were 54,495 non-U.S. citizens in the federal prison system (26.4 percent of the total of 206,784). Data from the federal prison system indicate that 11.1 percent of inmates (22,953) were serving time for immigration crimes. The Bureau of Prisons does not report the crimes of all inmates, but does say immigration crimes are 11.1 percent of the total. Unfortunately, the latest figures from the Federal Bureau of Prisons do not break down prisoners by citizenship and their crimes. Data for 2004, which are available, show that 94.3 percent of those serving time for immigration crimes were not U.S. citizens. Assuming the same share in 2009, then 21,645, or about one-third, of non-citizens are serving time for immigration crimes. This means that of the 183,831 inmates in the federal prison who are there for crimes unrelated to immigration, 32,850 (17.9 percent ) are non-citizens. For 2009 data, see www.bop.gov/news/quick.jsp#1. For 2004 data, see Table 1.3 of the Compendium of Federal Justice Statistics, 2004, At www.ojp.usdoj.gov/bjs/pub/pdf/cfjs04.pdf.
54 State Criminal Alien Assistance Program, FY 2005 Guidelines published by the U.S. Department of Justice, Office of Justice Programs, Bureau of Justice Assistance. See page 3, at http://www.ojp.usdoj.gov/BJA/grant/05SCAAPGuide.pdf.
55 DHS does not have estimates for the illegal population in 2004, so to create estimates for the illegal population that match the SCAAP 2005 reporting period we use the DHS estimates for January 2000 and January 2005 assuming a constant rate of growth. DHS estimates for the illegal population in 2005 and 2000 can be found at http://www.dhs.gov/xlibrary/assets/statistics/publications/ILL_PE_2005.pdf. DHS creates its estimates of illegal aliens from the American Community Survey. DHS adjusted upward its estimate of illegals in the ACS by 10 percent because of the undercount of illegal immigrants in the survey. The total population estimates that serve as the denominator in Table 6 are not adjusted upward. To make the numbers comparable it is necessary to reduce the DHS estimate of illegals in each state by 10 percent so that they match the total state population. The same applies to the 2000 illegal alien estimate from DHS except that instead of using the ACS 2000 numbers for total population it is necessary to use the decennial census. To see how DHS adjusts its estimates for undercount, see Table 2 in their 2005 illegal estimates in the link above. Adjustment f in Table 2 of the DHS report shows the 10 percent upward adjustment. Also see the discussion on pages 4 and 5 of the 2005 DHS illegal estimates.
56 State estimates for the illegal population from the INS can be found in Estimates of the Unauthorized Immigrant Population Residing in the United States: 1990 to 2000, issued in January 2003, at www.dhs.gov/xlibrary/assets/statistics/publications/Ill_Report_1211.pdf. Estimates for illegal aliens in 2000 and 2005 can be found in “Estimates of the Unauthorized Immigrant Population Residing in the United States: January 2005,” at www.dhs.gov/xlibrary/assets/statistics/publications/ILL_PE_2005.pdf.
57 See Table 37 in the 2007 Yearbook of Immigration Statistics, Department of Homeland Security, at http://www.dhs.gov/ximgtn/statistics/publications/YrBk07En.shtm.
58 See Table 4 in Immigration Enforcement Actions: 2007, at http://www.dhs.gov/xlibrary/assets/statistics/publications/enforcement_…;
59 See Criminal Offenders Statistics, Bureau of Justice Statistics, at http://www.ojp.usdoj.gov/bjs/crimoff.htm.
60 See Cooperation of SCAAP Recipients in the Removal of Criminal Aliens from the United States, U.S. Department of Justice Office of the Inspector General, Audit Report 07-07, January, 2007, at http://www.usdoj.gov/oig/reports/OJP/a0707/final.pdf.
61 TRAC Reports, Inc., “Immigration Prosecutions at Record Levels in FY 2009,” Syracuse University, http://trac.syr.edu/immigration/reports/218/.