An analysis of the Census Bureau’s monthly Current Population Survey (CPS) from January 2022 shows that the total immigrant population (legal and illegal) in the U.S., hit 46.6 million — the highest number ever in American history. Immigrants are also referred to by the government as the “foreign-born”. The growth and size of the immigrant population in the CPS are important because, unlike arrival figures for legal immigrants or border apprehensions, the CPS measures the total number of foreign-born people living in the country, which is what ultimately determines immigration’s impact on American society.
For the immigrant population to grow, new arrivals must exceed emigration and deaths. Births to immigrants, legal or illegal, in the U.S. do not add to the foreign-born — all children born in the U.S. are by definition native-born. After declining in size through the middle of 2020, as a result of Covid-19 travel restrictions, the foreign-born population rebounded dramatically after Biden’s victory. The restarting of visa processing overseas and the surge of illegal immigration at the border are the primary reasons for the dramatic growth. Some of the recent increase in the CPS may also be due to better data collection as the pandemic abated. Moreover, there is a lot of variation month to month in the data. However, the 1.6 million increase over the last year is quite large and statistically significant. The foreign-born in Census Bureau data includes all persons who were not U.S. citizens at birth — mainly naturalized citizens, lawful permanent residents, long-term temporary visitors, and illegal immigrants.
Among the findings:
- The 46.6 million immigrants (legal and illegal) in the country in January 2022 is the largest number recorded in any government survey or decennial census going back to 1850.
- The number of immigrants in the country grew 1.6 million between January 2021 and January 2022, after declining by 1.2 million between February and August 2020 at the height of the Covid pandemic.
- It is possible to see the recent rebound as a resumption of pre-Covid-19 trends. However, the increase in the immigrant population between January 2020, before Covid-19 hit, and January 2022 was nearly 2.2 million, or 1.1 million a year, much more than the 770,000 average annual increase in the decade before the pandemic.
- Hispanic immigrants accounted for 70 percent (1.1 million) of the increase in the foreign-born in the last year, indicating that a large share of growth was likely caused by illegal immigration. The federal government and outside researchers have estimated about three-quarters of illegal immigrants are Hispanic.
- As a share of the total population, immigrants were 14.2 percent — the highest percentage in 112 years.
- If present trends continue, the immigrant share is likely to surpass the all-time highs reached in 1890 (14.8 percent) and 1910 (14.7 percent) in the next few years.
- States with the largest increase in the immigrant population from January 2020 to January 2022 are Florida (up 531,000), Virginia (up 268,000), Texas (up 263,000), California (up 212,000), Indiana (up 205,000), Tennessee (up 198,000) and New Jersey (up 183,000).
Overview
Growth in the Immigrant Population. We use the terms “immigrant” and “foreign-born” interchangeably in this analysis. Figure 1 shows the total legal and illegal immigrant population living in the United States from January 2010 to January of 2022, along with margins of error. The figure shows that the immigrant population declined through the middle of 2020, hitting a low of 43.8 million in August and September of 2020. The foreign-born population has since rebounded, increasing by 2.8 million to 46.6 million in January of this year. Just between January 2021 and January of this year, it has increased by 1.6 million. Figure 2 shows the change in the immigrant population when compared to the same month in the prior year. The figure shows that the immigrant population began to grow, relative to the same month in the prior year, in December 2020 and has continued to increase every month thereafter.
 |
Click here for a larger version.
 |
Click here for a larger version.
In the sections below on the data, we discuss factors that may have impacted the number of immigrants in the CPS. But even taking into account potential issues with the data, it is still the case that the immigrant population increased by 1.6 million in the last year — January 2021 to January 2022. This increase is large and definitely statistically significant.1 One interpretation of the recent rebound in the foreign-born population is that it has simply made up for the slowdown during the pandemic, returning to pre-Covid trends. However, comparing January 2020, before Covid-19 had any impact on the data, and January 2022 shows an increase of nearly 2.2 million, or 1.1 million a year. This is a good deal more than the 770,000 average annual growth in the decade prior to January 2020. Thus the growth that began in the latter part of 2020 has not only made up for the 2020 slowdown, but it is also higher than the average in the years prior to Covid-19.
The Immigrant Share of the Population. Figure 3 reports the number of immigrants and the foreign-born share of the population going back to 1900. In January 2022, immigrants represented 14.2 percent of the nation’s total population — the highest percentage in 112 years.2 The immigrant share of the population has nearly doubled since 1990 (7.9 percent) and tripled since 1970 (4.7 percent). If present trends continue, the immigrant share is likely to surpass the all-time highs reached in 1890 (14.8 percent) and 1910 (14.7 percent) in the next few years. Figure 3 shows that when the Census Bureau last projected the foreign-born population in 2017, it estimated it would reach 14.9 percent of the population in 2027, a new record. Based on the latest data from the CPS, it is possible that the share will hit a new record even before 2027.
 |
Click here for a larger version.
The above percentage can be seen as understating the impact of immigration on the United States. Of the adult population, immigrants account for 17.4 percent of all persons 18 and older. Immigrants are a significantly larger share of adults than the total population because the vast majority of minor children in immigrant families are U.S.-born and are by definition not immigrants. Looking at children under 18, 26.4 percent (19.42 million) in January of this year had at least one immigrant parent. In total, there were 63.55 million immigrants and their minor children (under 18) living in the United States in January 2022, accounting for 19.4 percent of the total population. The 1970 census was the last time a decennial census asked a question about parental country of birth. At that time, 6.6 percent (13.46 million) of U.S. residents were immigrants or were the child (under 18) of an immigrant parent.
Understanding Growth in the Number of Immigrants. It is important to keep in mind that increases in the size of the foreign-born population can only be caused by new arrivals, so the large recent increases in the monthly CPS must be due to immigrants settling in the country. While only new arrivals can cause the foreign-born population to increase, the amount of net change in the number of immigrants also reflects the level of outmigration (emigration) by legal and illegal immigrants. We have previously estimated out-migration at nearly one million annually. The large recent increases in the total foreign-born population are an indication that out-migration likely fell in the last two years. Net changes in the number of immigrants are also impacted by natural mortality among the existing population, which was about 350,000 in 2021. In general, mortality does not fluctuate very much from year to year in the way that new arrivals or out-migration can.
The Impact of Covid-19. The decline in the immigrant population after February 2020 almost certainly reflects the significant reduction in new legal and illegal immigration caused by Covid-19 restrictions on international travel, the suspension of visa processing at American consulates overseas, the Remain in Mexico policy for asylum applicants, and Title 42 expulsions, which allowed the U.S. government to send illegal border-crossers immediately back to Mexico, even those not from that country. All of these factors, as well as others, significantly slowed the pace of new arrivals into the country. At the same time, some level of out-migration by immigrants continued during this time period, as did natural mortality, causing the total immigrant population to fall through the middle of 2020.
What’s Changed? A number of factors have likely contributed to the recent growth in the foreign-born population. The restarting of visa processing at American consulates has allowed many more permanent immigrants (green card holders) to arrive from abroad, as well as short-term (e.g., tourists) and long-term temporary visitors (e.g., guestworkers and students). The large surge of illegal immigrants at the southern border caused in part by the perception, based on his campaign promises, that President Biden would curtail immigration enforcement explains at least some of the growth in the immigrant population we are seeing. The administration’s decision to suspend nearly all deportations and the resulting dramatic decline in deportations, the ending of Remain in Mexico, the scaling back of Title 42 expulsions, and continuing efforts by the White House and some in Congress to pass a bill legalizing illegal immigrants have all likely made illegal immigrants feel safer, reducing emigration and encouraging new illegal immigration.
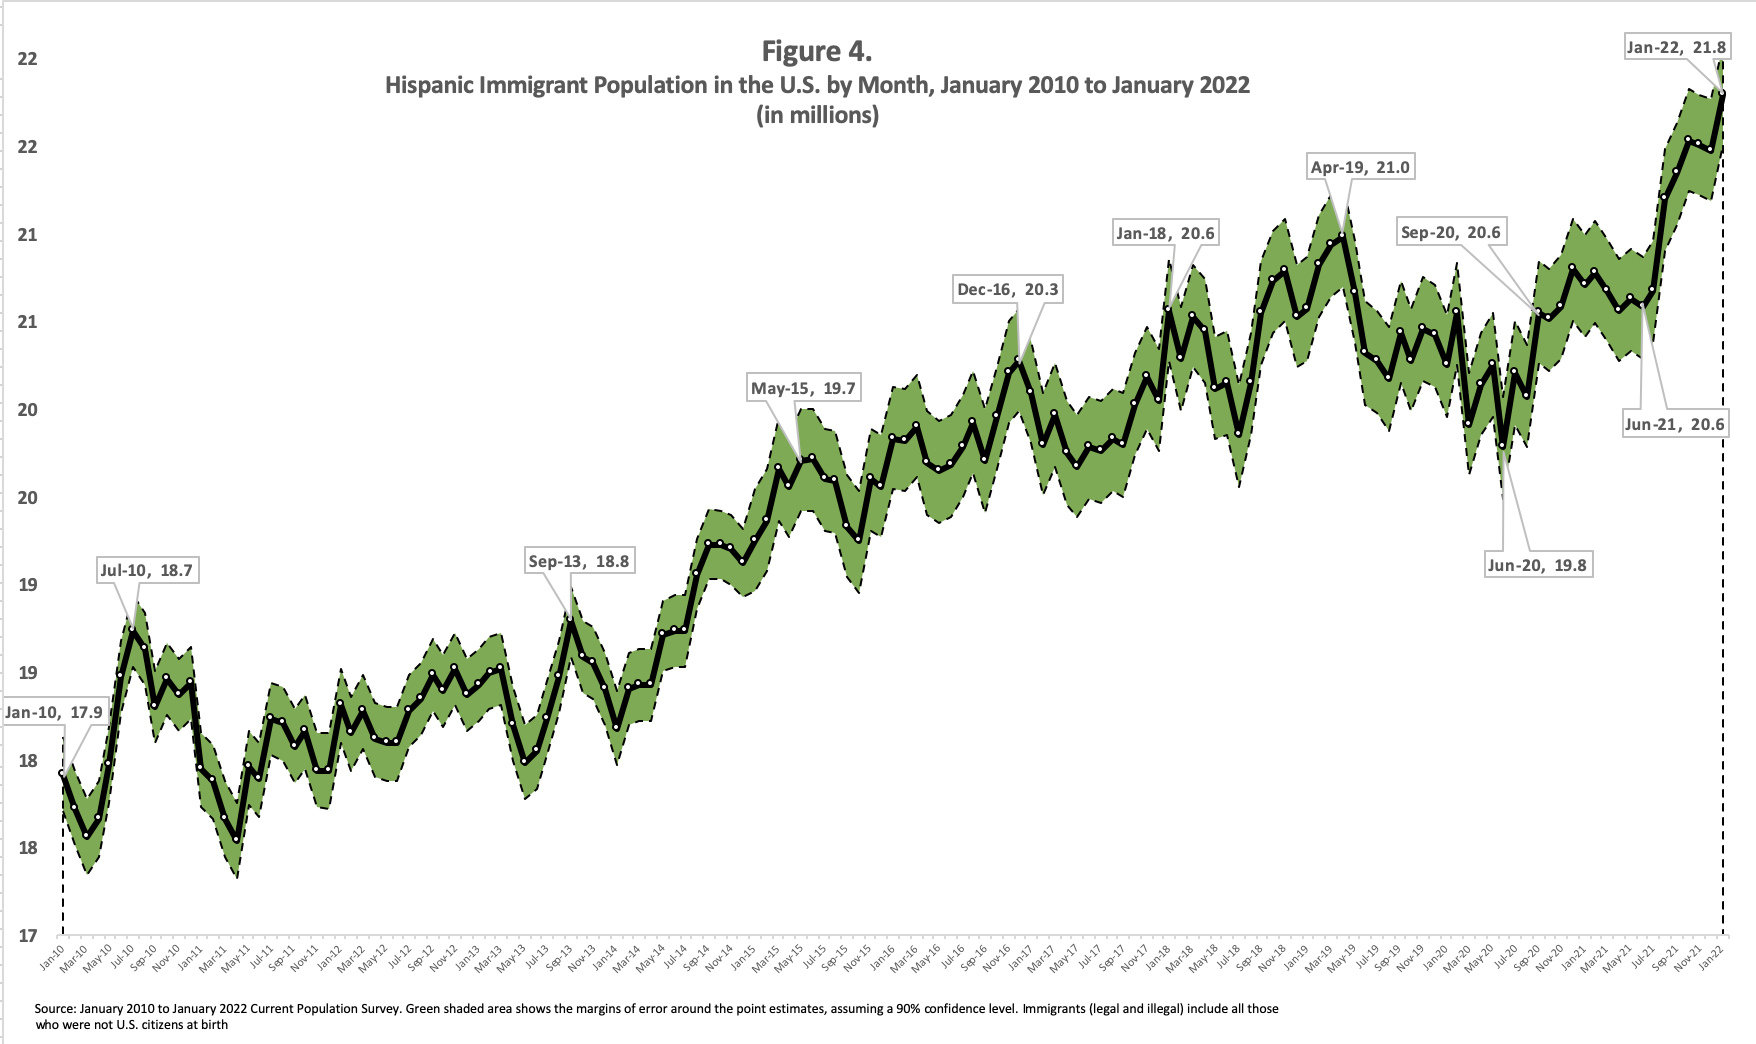
Illegal Immigration. The federal government, as well as outside researchers, have previously estimated that nearly three-quarters of illegal immigrants are Hispanic, so the recent increase in Hispanic immigrants can be seen as an indication that illegal immigration has increased dramatically in the last year.3 Hispanic immigrants accounted for 70 percent (1.1 million) of the increase in the total foreign-born population January 2021 to January 2022. Figure 4 shows the number of Hispanic immigrants living in the country and Figure 5 shows year-to-year monthly changes in that population. Like the overall foreign-born population, Figure 4 and Figure 5 show that the number of Hispanic immigrants fell at the height of the Covid-19 epidemic before rebounding dramatically at the end of 2020 and into 2021. This strongly suggests that the dramatic increase in illegal immigration at the southern border since President Biden’s election accounts for a significant share of the growth in the foreign-born population.
 |
Click here for a larger version.
 |
Click here for a larger version.
The Data. The monthly Current Population Survey (CPS) used in this analysis is one of the nation’s largest and oldest surveys. While it is collected by the Census Bureau, it is used primarily by the Bureau of Labor Statistics (BLS) to measure unemployment every month. The CPS surveys the non-institutionalized civilian population and is weighted by the Census Bureau to reflect the U.S. population. It must be remembered that the monthly CPS, while a large sample, still has a relatively large numerical margin of error of roughly ±500,000 for the foreign-born, assuming a 90 percent confidence level. This means numerical fluctuations from month to month can be quite large, making it necessary to compare changes over longer periods of time when drawing conclusions about trends.4
Each January, the population controls used to weight the CPS are re-adjusted to reflect updated information about births, deaths, and net international migration. The January 2022 adjustment had the effect of increasing the total civilian non-institutionalized population by 973,000. Of course, only a small share of this increase was among immigrants. The adjustments themselves are applied to race, gender, age, and other control variables. Foreign-born is not a control variable and varies based on responses to the survey. The whole point of the adjustments by the Census Bureau is to make the numbers more accurate. Nevertheless, the 411,000 growth in the foreign-born population between December 2021 and January 2022 should be interpreted in light of this upward adjustment in the population controls.
Potential Problems with the Data. The BLS reports that response rates to the CPS after March 2020 have been lower than prior to Covid-19, though rates have improved since hitting a low in June 2020. These lower rates increase the sampling error of the survey. It is not known if this problem had any specific impact on estimates of the foreign-born in the data. However, in June 2020, when the problem was most pronounced, BLS stated that “Although the response rate was adversely affected by pandemic-related issues, BLS was still able to obtain estimates that met our standards for accuracy and reliability.”
The Census Bureau’s Other Survey. Consistent with the monthly CPS, the Census Bureau’s much larger American Community Survey (ACS) from 2020 also shows a significant decline in the foreign-born population between 2019 and 2020. Unfortunately, the Census Bureau encountered significant problems collecting the 2020 ACS due to disruptions caused by Covid-19. As a result, the bureau states that it was “unable to collect information from certain segments of the population” for the ACS in 2020, particularly lower-income and less-educated individuals.5 But even if there were no problems with the 2020 ACS, it still would be a year and a half out of date at this point. The monthly CPS indicates that, with regard to immigrants, things have changed profoundly since the middle of 2020. Moreover, the ACS is an annual survey controlled to a July 1 date and therefore it does not reflect the restarting of legal immigration or the border crisis that began after July 2020. The 2021 ACS is still being collected and will probably not be released until September or October 2022.
End Notes
1 The margin of error using a 90 percent confidence level for January 2021 is 45.01 million ±481,000; using a 95 percent confidence level it is ±573,000; and using a 99 percent confidence level it is 754,000. The margin of error using a 90 percent confidence level for January 2022 is 46.57 million ±486,000; using a 95 percent confidence level it is ±579,00;0 and using a 99 percent confidence level it is 762,000. Thus, even using overlapping confidence intervals at the 99 percent significance level shows the difference between the number in January 2021 and January 2022 is statistically significant.
2 The CPS does not include the institutionalized population, primarily those in nursing homes and prisons. We can gauge the impact of including the institutionalized in the denominator by looking at the public-use annual American Community Survey (ACS), which does include the institutionalized. In 2019, immigrants (legal and illegal) were 13.64 percent of the total population in the ACS when the institutionalized were included and 13.72 percent when they were not included — less than one-tenth of a percentage-point difference. The distribution of immigrants across the institutionalized and non-institutionalized changes very little from year to year, so the foreign-born share of the population in January 2022 might have been about one-tenth of 1 percent lower if the entire population was used as the denominator.
3 It is important to note that this refers to the share of illegal immigrants who are Hispanic, not the share of Hispanic immigrants who are illegally in the country. Of all Hispanic immigrants, roughly 35 percent are in the country illegally based on prior analysis.
4 The margins of error shown in Figures 1 and 4 are based on standard errors calculated using parameter estimates, which reflect the survey’s complex design. Neither the BLS nor the Census Bureau has provided parameter estimates for the general population for the monthly CPS, so we use those for the labor force.
5 The Census Bureau has published a detailed analysis showing some of the problematic results in the 2020 ACS. Due to these problems with the 2020 ACS, the bureau has only put out a limited number of tables from it.